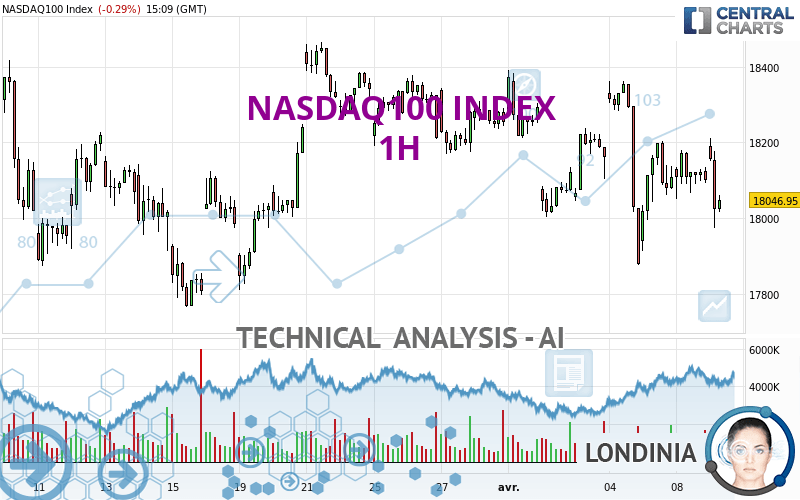
NASDAQ100 INDEX - 1H - Technical analysis published on 04/09/2024 (GMT)
- 152
- 0
Click here for a new analysis!
- Timeframe : 1H
- - Analysis generated on
- Status : INVALID

Summary of the analysis

Additional analysis
Quotes
NASDAQ100 INDEX rating 18,046.18 USD. The price registered a decrease of -0.30% on the session and was between 17,973.07 USD and 18,210.02 USD. This implies that the price is at +0.41% from its lowest and at -0.90% from its highest.The Central Gaps scanner detects a bullish gap which is a sign that buyers have taken the lead in the very short term.
Opening Gap UP
Type : Bullish
Timeframe : Openning
So that you have an overall view of the price change, here is a table showing the variations over several periods:
Near a new HIGH record (5 years)
Type : Bullish
Timeframe : Weekly
Near a new HIGH record (1 year)
Type : Bullish
Timeframe : Weekly
Near a new HIGH record (1st january)
Type : Bullish
Timeframe : Weekly
Near a new HIGH record (1 month)
Type : Bullish
Timeframe : Weekly
Technical
Technical analysis of NASDAQ100 INDEX in 1H shows an overall bearish trend. 78.57% of the signals given by moving averages are bearish. This bearish trend is supported by the strong bearish signals given by short-term moving averages. The Central Indicators scanner does not detect any result on moving averages that would impact this trend.
An assessment of technical indicators does not currently provide any relevant information to suggest whether the signal given by the technical indicators is more bullish or bearish.
Caution: the Central Indicators scanner currently detects an excess:
CCI indicator is oversold : under -100
Type : Neutral
Timeframe : 1 hour
Williams %R indicator is oversold : under -80
Type : Neutral
Timeframe : 1 hour
Pivot points : price is under support 2
Type : Neutral
Timeframe : 1 hour
RSI indicator is back under 50
Type : Bearish
Timeframe : 1 hour
MACD crosses DOWN its Moving Average
Type : Bearish
Timeframe : 1 hour
Price is back under the pivot point
Type : Bearish
Timeframe : Weekly
No signals are given by Central Patterns, a market scanner specialised in chart patterns, resistances and supports.
The Central Candlesticks scanner, specialised in Japanese candlesticks, did not identify any signals.
| S3 | S2 | S1 | Price | R1 | R2 | R3 | |
|---|---|---|---|---|---|---|---|
| ProTrendLines | 17,808.25 | 17,874.94 | 18,002.46 | 18,046.18 | 18,172.09 | 18,229.82 | 18,320.77 |
| Change (%) | -1.32% | -0.95% | -0.24% | - | +0.70% | +1.02% | +1.52% |
| Change | -237.93 | -171.24 | -43.72 | - | +125.91 | +183.64 | +274.59 |
| Level | Major | Intermediate | Minor | - | Minor | Minor | Intermediate |
Pivot points can also be used to set your price objectives. Here is the price situation in relation to pivot points:
| Pivot points | S3 | S2 | S1 | PP | R1 | R2 | R3 |
|---|---|---|---|---|---|---|---|
| Standard | 17,913.06 | 17,981.88 | 18,041.03 | 18,109.85 | 18,169.00 | 18,237.82 | 18,296.97 |
| Camarilla | 18,065.00 | 18,076.73 | 18,088.46 | 18,100.19 | 18,111.92 | 18,123.65 | 18,135.38 |
| Woodie | 17,908.24 | 17,979.46 | 18,036.21 | 18,107.43 | 18,164.18 | 18,235.40 | 18,292.15 |
| Fibonacci | 17,981.88 | 18,030.76 | 18,060.96 | 18,109.85 | 18,158.73 | 18,188.93 | 18,237.82 |
| Pivot points | S3 | S2 | S1 | PP | R1 | R2 | R3 |
|---|---|---|---|---|---|---|---|
| Standard | 17,343.12 | 17,609.43 | 17,858.95 | 18,125.26 | 18,374.78 | 18,641.09 | 18,890.61 |
| Camarilla | 17,966.61 | 18,013.89 | 18,061.18 | 18,108.46 | 18,155.74 | 18,203.03 | 18,250.31 |
| Woodie | 17,334.72 | 17,605.23 | 17,850.55 | 18,121.06 | 18,366.38 | 18,636.89 | 18,882.21 |
| Fibonacci | 17,609.43 | 17,806.48 | 17,928.22 | 18,125.26 | 18,322.31 | 18,444.05 | 18,641.09 |
| Pivot points | S3 | S2 | S1 | PP | R1 | R2 | R3 |
|---|---|---|---|---|---|---|---|
| Standard | 17,158.51 | 17,461.75 | 17,858.22 | 18,161.46 | 18,557.93 | 18,861.17 | 19,257.64 |
| Camarilla | 18,062.27 | 18,126.41 | 18,190.55 | 18,254.69 | 18,318.83 | 18,382.97 | 18,447.11 |
| Woodie | 17,205.13 | 17,485.06 | 17,904.84 | 18,184.77 | 18,604.55 | 18,884.48 | 19,304.26 |
| Fibonacci | 17,461.75 | 17,729.04 | 17,894.17 | 18,161.46 | 18,428.75 | 18,593.88 | 18,861.17 |
Numerical data
The following are the details of the technical indicators and moving averages that were collected to generate this technical analysis:
| RSI (14): | 41.15 | |
| MACD (12,26,9): | -24.3000 | |
| Directional Movement: | -13.03 | |
| AROON (14): | -7.14 | |
| DEMA (21): | 18,089.26 | |
| Parabolic SAR (0,02-0,02-0,2): | 17,882.43 | |
| Elder Ray (13): | -27.99 | |
| Super Trend (3,10): | 18,236.87 | |
| Zig ZAG (10): | 17,989.88 | |
| VORTEX (21): | 0.8100 | |
| Stochastique (14,3,5): | 46.59 | |
| TEMA (21): | 18,077.83 | |
| Williams %R (14): | -99.64 | |
| Chande Momentum Oscillator (20): | -223.64 | |
| Repulse (5,40,3): | -1.6000 | |
| ROCnROLL: | 2 | |
| TRIX (15,9): | -0.0200 | |
| Courbe Coppock: | 0.23 |
| MA7: | 18,098.13 | |
| MA20: | 18,135.56 | |
| MA50: | 17,938.61 | |
| MA100: | 17,214.52 | |
| MAexp7: | 18,099.96 | |
| MAexp20: | 18,122.98 | |
| MAexp50: | 18,156.20 | |
| MAexp100: | 18,155.49 | |
| Price / MA7: | -0.29% | |
| Price / MA20: | -0.49% | |
| Price / MA50: | +0.60% | |
| Price / MA100: | +4.83% | |
| Price / MAexp7: | -0.29% | |
| Price / MAexp20: | -0.42% | |
| Price / MAexp50: | -0.60% | |
| Price / MAexp100: | -0.60% |
News
Don't forget to follow the news on NASDAQ100 INDEX. At the time of publication of this analysis, the latest news was as follows:
-
 Nasdaq Forecast and Technical Analysis, April 9, 2024, by Chris Lewis #fxempire #trading #nasdaq
-
NASDAQ 100 Forecast April 10, 2024
-
NASDAQ 100 Daily Forecast and Technical Analysis for April 09, 2024, by Chris Lewis for FX Empire
-
NASDAQ 100 Daily Forecast and Technical Analysis for April 08, 2024, by Chris Lewis for FX Empire
-
NASDAQ 100 Long Term Forecast, Technical Analysis for April 05, 2024, by Chris Lewis for FX Empire
About author

Online


Add a comment
Comments
0 comments on the analysis NASDAQ100 INDEX - 1H