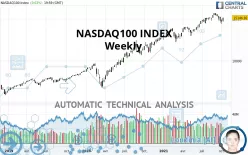
NASDAQ100 INDEX - Weekly - Technical analysis published on 10/18/2021 (GMT)
- 336
- 0
Click here for a new analysis!
- Timeframe : Weekly
- - Analysis generated on
- Status : TARGET REACHED

Summary of the analysis

Additional analysis
Quotes
NASDAQ100 INDEX rating 15,146.92 USD. The price registered an increase of +2.94% over 5 days with the lowest point at 14,901.60 USD and the highest point at 15,150.10 USD. The deviation from the price is +1.65% for the low point and -0.02% for the high point.The Central Gaps scanner detects a bullish gap which is a sign that buyers have taken the lead in the very short term.
Opening Gap UP
Type : Bullish
Timeframe : Openning
Here is a more detailed summary of the historical variations registered by NASDAQ100 INDEX:
Near a new HIGH record (5 years)
Type : Bullish
Timeframe : Weekly
Near a new HIGH record (1 year)
Type : Bullish
Timeframe : Weekly
Near a new HIGH record (1st january)
Type : Bullish
Timeframe : Weekly
Technical
Technical analysis of this Weekly chart of NASDAQ100 INDEX indicates that the overall trend is strongly bullish. The signals given by the moving averages are 92.86% bullish. This strong bullish trend is confirmed by the strong signals currently being given by short-term moving averages. The Central Indicators market scanner currently does not detect any result that concerns moving averages.
In fact, of the 18 technical indicators analysed by Central Analyzer, 7 are bullish, 7 are neutral and 4 are bearish. Central Indicators, the detector scanner for these technical indicators has recently detected several signals:
Pivot points : price is over resistance 1
Type : Neutral
Timeframe : Weekly
Williams %R indicator is back over -50
Type : Bullish
Timeframe : Weekly
No signals are given by Central Patterns, a market scanner specialised in chart patterns, resistances and supports.
No result was found by the Central Candlesticks scanner on Japanese candlesticks.
| S3 | S2 | S1 | Price | R1 | |
|---|---|---|---|---|---|
| ProTrendLines | 12,299.10 | 14,041.90 | 14,857.90 | 15,146.92 | 15,675.80 |
| Change (%) | -18.80% | -7.30% | -1.91% | - | +3.49% |
| Change | -2,847.82 | -1,105.02 | -289.02 | - | +528.88 |
| Level | Major | Intermediate | Intermediate | - | Major |
Attention could also be paid to pivot points to set price objectives:
| Pivot points | S3 | S2 | S1 | PP | R1 | R2 | R3 |
|---|---|---|---|---|---|---|---|
| Standard | 15,005.41 | 15,035.00 | 15,090.96 | 15,120.55 | 15,176.51 | 15,206.10 | 15,262.06 |
| Camarilla | 15,123.39 | 15,131.24 | 15,139.08 | 15,146.92 | 15,154.76 | 15,162.60 | 15,170.45 |
| Woodie | 15,018.60 | 15,041.59 | 15,104.15 | 15,127.14 | 15,189.70 | 15,212.69 | 15,275.25 |
| Fibonacci | 15,035.00 | 15,067.68 | 15,087.87 | 15,120.55 | 15,153.23 | 15,173.42 | 15,206.10 |
| Pivot points | S3 | S2 | S1 | PP | R1 | R2 | R3 |
|---|---|---|---|---|---|---|---|
| Standard | 13,841.57 | 14,113.23 | 14,466.97 | 14,738.63 | 15,092.37 | 15,364.03 | 15,717.77 |
| Camarilla | 14,648.72 | 14,706.04 | 14,763.37 | 14,820.70 | 14,878.03 | 14,935.36 | 14,992.69 |
| Woodie | 13,882.60 | 14,133.75 | 14,508.00 | 14,759.15 | 15,133.40 | 15,384.55 | 15,758.80 |
| Fibonacci | 14,113.23 | 14,352.14 | 14,499.73 | 14,738.63 | 14,977.54 | 15,125.13 | 15,364.03 |
| Pivot points | S3 | S2 | S1 | PP | R1 | R2 | R3 |
|---|---|---|---|---|---|---|---|
| Standard | 13,332.03 | 14,008.27 | 14,348.93 | 15,025.17 | 15,365.83 | 16,042.07 | 16,382.73 |
| Camarilla | 14,409.95 | 14,503.17 | 14,596.38 | 14,689.60 | 14,782.82 | 14,876.03 | 14,969.25 |
| Woodie | 13,164.25 | 13,924.38 | 14,181.15 | 14,941.28 | 15,198.05 | 15,958.18 | 16,214.95 |
| Fibonacci | 14,008.27 | 14,396.72 | 14,636.71 | 15,025.17 | 15,413.62 | 15,653.61 | 16,042.07 |
Numerical data
The following are the details of the technical indicators and moving averages that were collected to generate this technical analysis:
| RSI (14): | 60.48 | |
| MACD (12,26,9): | 431.4600 | |
| Directional Movement: | -2.82 | |
| AROON (14): | -28.57 | |
| DEMA (21): | 15,439.03 | |
| Parabolic SAR (0,02-0,02-0,2): | 15,563.42 | |
| Elder Ray (13): | -121.35 | |
| Super Trend (3,10): | 14,433.07 | |
| Zig ZAG (10): | 15,146.92 | |
| VORTEX (21): | 1.1600 | |
| Stochastique (14,3,5): | 40.36 | |
| TEMA (21): | 15,334.08 | |
| Williams %R (14): | -42.12 | |
| Chande Momentum Oscillator (20): | 35.12 | |
| Repulse (5,40,3): | 4.4600 | |
| ROCnROLL: | 1 | |
| TRIX (15,9): | 0.5400 | |
| Courbe Coppock: | 10.30 |
| MA7: | 14,866.79 | |
| MA20: | 14,902.64 | |
| MA50: | 15,158.12 | |
| MA100: | 14,805.05 | |
| MAexp7: | 15,097.33 | |
| MAexp20: | 14,809.80 | |
| MAexp50: | 13,741.43 | |
| MAexp100: | 12,196.25 | |
| Price / MA7: | +1.88% | |
| Price / MA20: | +1.64% | |
| Price / MA50: | -0.07% | |
| Price / MA100: | +2.31% | |
| Price / MAexp7: | +0.33% | |
| Price / MAexp20: | +2.28% | |
| Price / MAexp50: | +10.23% | |
| Price / MAexp100: | +24.19% |
News
The last news published on NASDAQ100 INDEX at the time of the generation of this analysis was as follows:
-
 S&P 500 and NASDAQ 100 Forecast October 18, 2021
-
S&P 500 and NASDAQ 100 Forecast October 15, 2021
-
“The Buzz'' Show: NeuroBo Pharmaceuticals (NASDAQ: NRBO) Independent Data Safety Committee
-
S&P 500 and NASDAQ 100 Forecast October 14, 2021
-
“The Buzz'' Show: Nutriband Inc. (NASDAQ: NTRB) Manufacturing Agreement with Diomics
About author

Online


Add a comment
Comments
0 comments on the analysis NASDAQ100 INDEX - Weekly