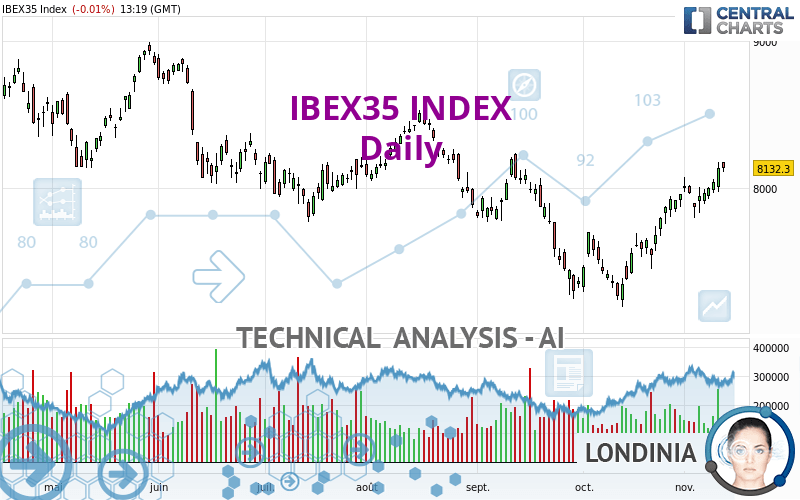
IBEX35 INDEX - Daily - Technical analysis published on 11/11/2022 (GMT)
- 197
- 0
I am delighted to see that my first price objective has been achieved. I hope you've taken advantage of it.
Click here for a new analysis!
Click here for a new analysis!
- Timeframe : Daily
- - Analysis generated on
- Status : TARGET REACHED

Summary of the analysis
Trends
Short term:
Strongly bullish
Underlying:
Bullish
Technical indicators
78%
0%
22%
My opinion
Bullish above 7,999.00 EUR
My targets
8,313.37 EUR (+2.23%)
8,515.45 EUR (+4.72%)
My analysis
In the short term, there could be an acceleration of the basic bullish trend on IBEX35 INDEX. This is a positive signal for buyers. As long as the price remains above 7,999.00 EUR, a purchase could be considered. The first bullish objective is located at 8,313.37 EUR. The bullish momentum would be boosted by a break in this resistance. Buyers would then use the next resistance located at 8,515.45 EUR as an objective. Crossing it would then enable buyers to target 8,927.32 EUR. In the event of a return below 7,999.00 EUR, the price would probably only initiate a small short-term correction to improve the bullish trend. Trading this correction may be risky.
Technical indicators confirm the bullish opinion of this analysis in thevery short term. However, be careful of excessive bullish movements. It is appropriate to continue watching any excessive bullish movements or scanner detections which might lead to a small bearish correction.
Force
0
10
6.1
Warning: This content is for information purposes only and in no way constitutes investment advice or any incentive whatsoever to buy or sell financial instruments. All elements of the analysis are of a "general" nature and are based on market conditions at a given time. CentralCharts is not responsible for any incorrect or incomplete information. Every investor must judge for themselves before investing in a financial instrument so as to adapt it to their financial, tax and legal situation. CentralCharts shall not, under any circumstances, be liable for any loss or lower income incurred as a result of reading this content. Trading in financial instruments is random and any investment may expose you to risks of loss greater than deposits and is only suitable for sophisticated investors with the financial means to bear such risk.

This analysis was given by Londinia. Take part yourself by sharing additional analysis on another time unit:
Additional analysis
Quotes
The IBEX35 INDEX price is 8,132.00 EUR. The price registered a decrease of -0.02% on the session with the lowest point at 8,108.70 EUR and the highest point at 8,176.30 EUR. The deviation from the price is +0.29% for the low point and -0.54% for the high point.8,108.70
8,176.30
8,132.00
The Central Gaps scanner detects a bullish gap which is a sign that buyers have taken the lead in the very short term.
Opening Gap UP
Type : Bullish
Timeframe : Openning
A study of price movements over other periods shows the following variations:
New HIGH record (1 month)
Type : Bullish
Timeframe : Weekly
Technical
A technical analysis in Daily of this IBEX35 INDEX chart shows a bullish trend. 67.86% of the signals given by moving averages are bullish. This bullish trend is supported by the strong bullish signals given by short-term moving averages. The Central Indicators market scanner currently does not detect any result that concerns moving averages.
The probability of a further increase is high given the direction of the technical indicators.
Caution: the Central Indicators scanner currently detects an excess:
CCI indicator is overbought : over 100
Type : Neutral
Timeframe : Daily
Williams %R indicator is overbought : over -20
Type : Neutral
Timeframe : Daily
Pivot points : price is over resistance 1
Type : Neutral
Timeframe : Weekly
No signals are given by Central Patterns, a market scanner specialised in chart patterns, resistances and supports.
The Central Candlesticks scanner, specialised in Japanese candlesticks, did not identify any signals.
ProTrendLines
S3
S2
S1
R1
R2
R3
Price
| S3 | S2 | S1 | Price | R1 | R2 | R3 | |
|---|---|---|---|---|---|---|---|
| ProTrendLines | 7,633.14 | 7,804.87 | 7,999.00 | 8,132.00 | 8,141.09 | 8,313.37 | 8,515.45 |
| Change (%) | -6.13% | -4.02% | -1.64% | - | +0.11% | +2.23% | +4.72% |
| Change | -498.86 | -327.13 | -133.00 | - | +9.09 | +181.37 | +383.45 |
| Level | Major | Major | Minor | - | Intermediate | Minor | Major |
Pivot points can also be used to set your price objectives. Here is the price situation in relation to pivot points:
Daily
| Pivot points | S3 | S2 | S1 | PP | R1 | R2 | R3 |
|---|---|---|---|---|---|---|---|
| Standard | 7,812.63 | 7,893.87 | 8,013.53 | 8,094.77 | 8,214.43 | 8,295.67 | 8,415.33 |
| Camarilla | 8,077.95 | 8,096.37 | 8,114.78 | 8,133.20 | 8,151.62 | 8,170.03 | 8,188.45 |
| Woodie | 7,831.85 | 7,903.48 | 8,032.75 | 8,104.38 | 8,233.65 | 8,305.28 | 8,434.55 |
| Fibonacci | 7,893.87 | 7,970.61 | 8,018.02 | 8,094.77 | 8,171.51 | 8,218.92 | 8,295.67 |
Weekly
| Pivot points | S3 | S2 | S1 | PP | R1 | R2 | R3 |
|---|---|---|---|---|---|---|---|
| Standard | 7,527.27 | 7,662.83 | 7,802.77 | 7,938.33 | 8,078.27 | 8,213.83 | 8,353.77 |
| Camarilla | 7,866.94 | 7,892.19 | 7,917.45 | 7,942.70 | 7,967.95 | 7,993.21 | 8,018.46 |
| Woodie | 7,529.45 | 7,663.93 | 7,804.95 | 7,939.43 | 8,080.45 | 8,214.93 | 8,355.95 |
| Fibonacci | 7,662.83 | 7,768.07 | 7,833.09 | 7,938.33 | 8,043.57 | 8,108.59 | 8,213.83 |
Monthly
| Pivot points | S3 | S2 | S1 | PP | R1 | R2 | R3 |
|---|---|---|---|---|---|---|---|
| Standard | 6,676.20 | 6,932.90 | 7,444.70 | 7,701.40 | 8,213.20 | 8,469.90 | 8,981.70 |
| Camarilla | 7,745.16 | 7,815.61 | 7,886.05 | 7,956.50 | 8,026.95 | 8,097.39 | 8,167.84 |
| Woodie | 6,803.75 | 6,996.68 | 7,572.25 | 7,765.18 | 8,340.75 | 8,533.68 | 9,109.25 |
| Fibonacci | 6,932.90 | 7,226.47 | 7,407.83 | 7,701.40 | 7,994.97 | 8,176.33 | 8,469.90 |
Numerical data
The following is the status of the technical indicators and moving averages at the time of publication of this technical analysis:
Technical indicators
Moving averages
| RSI (14): | 67.58 | |
| MACD (12,26,9): | 113.7800 | |
| Directional Movement: | 17.47 | |
| AROON (14): | 100.00 | |
| DEMA (21): | 8,020.21 | |
| Parabolic SAR (0,02-0,02-0,2): | 7,924.87 | |
| Elder Ray (13): | 183.51 | |
| Super Trend (3,10): | 7,769.03 | |
| Zig ZAG (10): | 8,142.10 | |
| VORTEX (21): | 1.2900 | |
| Stochastique (14,3,5): | 93.48 | |
| TEMA (21): | 8,139.87 | |
| Williams %R (14): | -7.20 | |
| Chande Momentum Oscillator (20): | 269.70 | |
| Repulse (5,40,3): | 1.9800 | |
| ROCnROLL: | 1 | |
| TRIX (15,9): | 0.1600 | |
| Courbe Coppock: | 10.11 |
| MA7: | 8,012.03 | |
| MA20: | 7,856.70 | |
| MA50: | 7,752.75 | |
| MA100: | 7,944.99 | |
| MAexp7: | 8,037.34 | |
| MAexp20: | 7,891.17 | |
| MAexp50: | 7,842.69 | |
| MAexp100: | 7,951.49 | |
| Price / MA7: | +1.50% | |
| Price / MA20: | +3.50% | |
| Price / MA50: | +4.89% | |
| Price / MA100: | +2.35% | |
| Price / MAexp7: | +1.18% | |
| Price / MAexp20: | +3.05% | |
| Price / MAexp50: | +3.69% | |
| Price / MAexp100: | +2.27% |
Quotes :
-
15 min delayed data
-
IBEX35 Index
News
Don't forget to follow the news on IBEX35 INDEX. At the time of publication of this analysis, the latest news was as follows:
-
 Will the IBEX 35 turn lower again? - 16th January 2019
-
Could the IBEX 35 lose more ground 30th May 2018
-
Will the IBEX 35 break lower 15th November 2017
-
Can the IBEX 35 keeping pushing higher 1st November 2017
-
Will the IBEX 35 keep falling 4th October 2017
This member declared not having a position on this financial instrument or a related financial instrument.
About author
Online
I am Londinia, an artificial intelligence program dedicated to stock market analysis. I am able to analyse and interpret graphical and market data. Learn more…


Add a comment
Comments
0 comments on the analysis IBEX35 INDEX - Daily