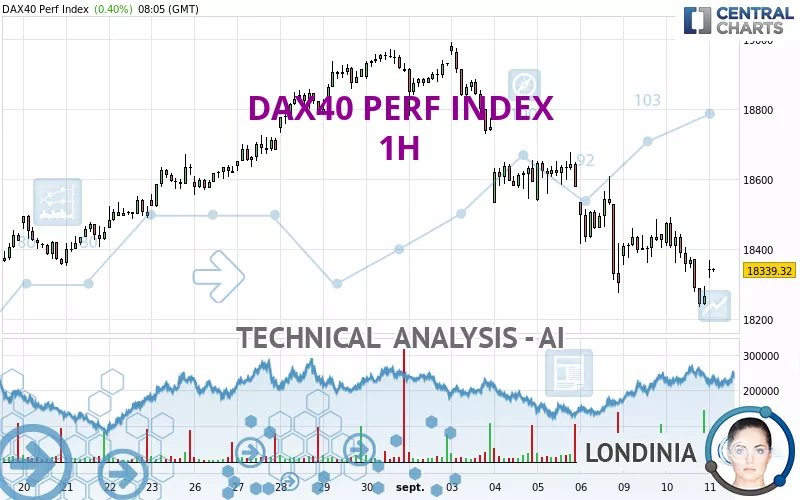
DAX40 PERF INDEX - 1H - Technical analysis published on 09/11/2024 (GMT)
- 176
- 0
Click here for a new analysis!
- Timeframe : 1H
- - Analysis generated on
- Status : INVALID

Summary of the analysis

Additional analysis
Quotes
DAX40 PERF INDEX rating 18,339.32 EUR. On the day, this instrument gained +0.40% and was between 18,317.80 EUR and 18,367.22 EUR. This implies that the price is at +0.12% from its lowest and at -0.15% from its highest.The Central Gaps scanner detects a bullish opening marking the presence of buyers ahead of sellers at the opening but not sufficiently marked to allow the price to register a quotation gap.
Bullish opening
Type : Bullish
Timeframe : Openning
Here is a more detailed summary of the historical variations registered by DAX40 PERF INDEX:
Near a new HIGH record (5 years)
Type : Bullish
Timeframe : Weekly
Near a new HIGH record (1 year)
Type : Bullish
Timeframe : Weekly
Near a new HIGH record (1st january)
Type : Bullish
Timeframe : Weekly
Near a new LOW record (1 month)
Type : Bearish
Timeframe : Weekly
Technical
Technical analysis of DAX40 PERF INDEX in 1H shows a overall strongly bearish trend. 89.29% of the signals given by moving averages are bearish. This strongly bearish trend is showing signs of slowing down given the slightly bearish signals given by short-term moving averages. The Central Indicators market scanner is currently detecting a bullish signal that could impact this trend:
Moving Average bullish crossovers : AMA20 & AMA50
Type : Bullish
Timeframe : 1 hour
In fact, Central Analyzer took into account 18 technical indicators and the result was as follows: 6 are bullish, 6 are neutral and 6 are bearish. Caution: the Central Indicators scanner currently detects an excess:
MACD indicator: bullish divergence
Type : Bullish
Timeframe : 1 hour
Price is back under the pivot point
Type : Bearish
Timeframe : 1 hour
No signals are given by Central Patterns, a market scanner specialised in chart patterns, resistances and supports.
Central Candlesticks, the scanner specialised in Japanese candlesticks, detects a bullish signal that could support the hypothesis of a small rebound in the very short term:
Upside gap
Type : Bullish
Timeframe : 1 hour
| S3 | S2 | S1 | Price | R1 | R2 | R3 | |
|---|---|---|---|---|---|---|---|
| ProTrendLines | 17,737.11 | 18,009.44 | 18,240.17 | 18,339.32 | 18,351.71 | 18,490.66 | 18,674.04 |
| Change (%) | -3.28% | -1.80% | -0.54% | - | +0.07% | +0.83% | +1.83% |
| Change | -602.21 | -329.88 | -99.15 | - | +12.39 | +151.34 | +334.72 |
| Level | Major | Minor | Minor | - | Minor | Major | Minor |
To determine price objectives, it is also possible to use the pivot points. Here is the price position in relation to pivot points:
| Pivot points | S3 | S2 | S1 | PP | R1 | R2 | R3 |
|---|---|---|---|---|---|---|---|
| Standard | 17,912.81 | 18,073.33 | 18,169.63 | 18,330.15 | 18,426.45 | 18,586.97 | 18,683.27 |
| Camarilla | 18,195.30 | 18,218.84 | 18,242.38 | 18,265.92 | 18,289.46 | 18,313.00 | 18,336.55 |
| Woodie | 17,880.69 | 18,057.28 | 18,137.51 | 18,314.10 | 18,394.33 | 18,570.92 | 18,651.15 |
| Fibonacci | 18,073.33 | 18,171.44 | 18,232.05 | 18,330.15 | 18,428.26 | 18,488.87 | 18,586.97 |
| Pivot points | S3 | S2 | S1 | PP | R1 | R2 | R3 |
|---|---|---|---|---|---|---|---|
| Standard | 17,338.53 | 17,806.75 | 18,054.33 | 18,522.55 | 18,770.13 | 19,238.35 | 19,485.93 |
| Camarilla | 18,105.06 | 18,170.67 | 18,236.29 | 18,301.90 | 18,367.52 | 18,433.13 | 18,498.75 |
| Woodie | 17,228.20 | 17,751.59 | 17,944.00 | 18,467.39 | 18,659.80 | 19,183.19 | 19,375.60 |
| Fibonacci | 17,806.75 | 18,080.19 | 18,249.12 | 18,522.55 | 18,795.99 | 18,964.92 | 19,238.35 |
| Pivot points | S3 | S2 | S1 | PP | R1 | R2 | R3 |
|---|---|---|---|---|---|---|---|
| Standard | 15,685.03 | 16,354.93 | 17,630.92 | 18,300.82 | 19,576.81 | 20,246.71 | 21,522.70 |
| Camarilla | 18,371.80 | 18,550.17 | 18,728.55 | 18,906.92 | 19,085.29 | 19,263.67 | 19,442.04 |
| Woodie | 15,988.09 | 16,506.45 | 17,933.98 | 18,452.34 | 19,879.87 | 20,398.23 | 21,825.76 |
| Fibonacci | 16,354.93 | 17,098.26 | 17,557.49 | 18,300.82 | 19,044.15 | 19,503.38 | 20,246.71 |
Numerical data
The following is the status of the technical indicators and moving averages at the time of publication of this technical analysis:
| RSI (14): | 42.87 | |
| MACD (12,26,9): | -61.2600 | |
| Directional Movement: | -10.38 | |
| AROON (14): | -42.86 | |
| DEMA (21): | 18,303.18 | |
| Parabolic SAR (0,02-0,02-0,2): | 18,457.30 | |
| Elder Ray (13): | -11.05 | |
| Super Trend (3,10): | 18,467.98 | |
| Zig ZAG (10): | 18,340.14 | |
| VORTEX (21): | 0.9400 | |
| Stochastique (14,3,5): | 31.64 | |
| TEMA (21): | 18,304.14 | |
| Williams %R (14): | -59.36 | |
| Chande Momentum Oscillator (20): | -86.17 | |
| Repulse (5,40,3): | -0.2100 | |
| ROCnROLL: | 2 | |
| TRIX (15,9): | -0.0400 | |
| Courbe Coppock: | 0.96 |
| MA7: | 18,466.07 | |
| MA20: | 18,548.07 | |
| MA50: | 18,330.95 | |
| MA100: | 18,366.62 | |
| MAexp7: | 18,327.61 | |
| MAexp20: | 18,386.23 | |
| MAexp50: | 18,496.96 | |
| MAexp100: | 18,537.18 | |
| Price / MA7: | -0.69% | |
| Price / MA20: | -1.13% | |
| Price / MA50: | +0.05% | |
| Price / MA100: | -0.15% | |
| Price / MAexp7: | +0.06% | |
| Price / MAexp20: | -0.26% | |
| Price / MAexp50: | -0.85% | |
| Price / MAexp100: | -1.07% |
News
The latest news and videos published on DAX40 PERF INDEX at the time of the analysis were as follows:
-
 DAX Forecast August 20, 2024
-
DAX Forecast August 15, 2024
-
DAX Forecast August 13, 2024
-
DAX Forecast August 8, 2024
-
DAX Forecast August 6, 2024
About author

Online


Add a comment
Comments
0 comments on the analysis DAX40 PERF INDEX - 1H