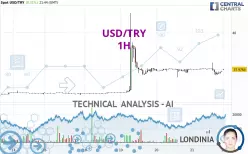
USD/TRY - 1H - Technical analysis published on 03/23/2025 (GMT)
- 292
- 0
Click here for a new analysis!
- Timeframe : 1H
- - Analysis generated on
- Status : LEVEL MAINTAINED

Summary of the analysis

Additional analysis
Quotes
The USD/TRY rating is 37.9764 TRY. On the day, this instrument gained +0.31% and was between 37.9437 TRY and 37.9930 TRY. This implies that the price is at +0.09% from its lowest and at -0.04% from its highest.The Central Gaps scanner detects a bearish opening marking the presence of sellers ahead of buyers at the opening but not sufficiently marked to allow the price to register a quotation gap.
Bearish opening
Type : Bearish
Timeframe : Openning
A study of price movements over other periods shows the following variations:
New HIGH record (5 years)
Type : Bullish
Timeframe : Weekly
Near a new LOW record (1 month)
Type : Bearish
Timeframe : Weekly
Technical
Technical analysis of this 1H chart of USD/TRY indicates that the overall trend is bullish. 75.00% of the signals given by moving averages are bullish. The overall trend seems to be showing some signs of weakness, as do the tentative bullish signals given by short-term moving averages. An assessment of moving averages reveals a bullish signal that could impact this trend:
Bullish trend reversal : adaptative moving average 50
Type : Bullish
Timeframe : 1 hour
In fact, of the 18 technical indicators analysed by Central Analyzer, 6 are bullish, 8 are neutral and 4 are bearish. Other results related to technical indicators were also found by the Central Indicators scanner:
Pivot points : price is over resistance 3 (Daily)
Type : Neutral
Timeframe : Weekly
Price is back over the pivot point (Daily)
Type : Bullish
Timeframe : 1 hour
Pivot points : price is over resistance 3 (Weekly)
Type : Neutral
Timeframe : 1 hour
Pivot points : price is over resistance 3 (Monthly)
Type : Neutral
Timeframe : 1 hour
The Central Patterns scanner, which studies chart patterns, resistances and supports, has identified these signals:
Near horizontal support
Type : Bullish
Timeframe : 1 hour
Support of channel is broken
Type : Bearish
Timeframe : 1 hour
The Central Candlesticks scanner which studies Japanese candlesticks did not detect anything.
| S3 | S2 | S1 | Price | R1 | R2 | |
|---|---|---|---|---|---|---|
| ProTrendLines | 35.6205 | 36.5471 | 37.5361 | 37.9764 | 38.0096 | 41.0859 |
| Change (%) | -6.20% | -3.76% | -1.16% | - | +0.09% | +8.19% |
| Change | -2.3559 | -1.4293 | -0.4403 | - | +0.0332 | +3.1095 |
| Level | Minor | Major | Minor | - | Intermediate | Minor |
To determine price objectives, it is also possible to use the pivot points. Here is the price position in relation to pivot points:
| Pivot points | S3 | S2 | S1 | PP | R1 | R2 | R3 |
|---|---|---|---|---|---|---|---|
| Standard | 36.8558 | 37.2548 | 37.5571 | 37.9561 | 38.2584 | 38.6574 | 38.9597 |
| Camarilla | 37.6665 | 37.7308 | 37.7951 | 37.8594 | 37.9237 | 37.9880 | 38.0523 |
| Woodie | 36.8075 | 37.2306 | 37.5088 | 37.9319 | 38.2101 | 38.6332 | 38.9114 |
| Fibonacci | 37.2548 | 37.5227 | 37.6882 | 37.9561 | 38.2240 | 38.3895 | 38.6574 |
| Pivot points | S3 | S2 | S1 | PP | R1 | R2 | R3 |
|---|---|---|---|---|---|---|---|
| Standard | 31.4444 | 34.0180 | 35.9387 | 38.5123 | 40.4330 | 43.0066 | 44.9273 |
| Camarilla | 36.6235 | 37.0355 | 37.4474 | 37.8594 | 38.2714 | 38.6834 | 39.0953 |
| Woodie | 31.1180 | 33.8548 | 35.6123 | 38.3491 | 40.1066 | 42.8434 | 44.6009 |
| Fibonacci | 34.0180 | 35.7348 | 36.7955 | 38.5123 | 40.2291 | 41.2898 | 43.0066 |
| Pivot points | S3 | S2 | S1 | PP | R1 | R2 | R3 |
|---|---|---|---|---|---|---|---|
| Standard | 34.9686 | 35.3608 | 35.9204 | 36.3126 | 36.8722 | 37.2644 | 37.8240 |
| Camarilla | 36.2183 | 36.3055 | 36.3928 | 36.4800 | 36.5673 | 36.6545 | 36.7418 |
| Woodie | 35.0523 | 35.4027 | 36.0041 | 36.3545 | 36.9559 | 37.3063 | 37.9077 |
| Fibonacci | 35.3608 | 35.7244 | 35.9490 | 36.3126 | 36.6762 | 36.9008 | 37.2644 |
Numerical data
The following is the status of the technical indicators and moving averages at the time of publication of this technical analysis:
| RSI (14): | 45.48 | |
| MACD (12,26,9): | -0.0330 | |
| Directional Movement: | 6.3924 | |
| AROON (14): | -14.2857 | |
| DEMA (21): | 37.8699 | |
| Parabolic SAR (0,02-0,02-0,2): | 38.2013 | |
| Elder Ray (13): | -0.0160 | |
| Super Trend (3,10): | 38.0918 | |
| Zig ZAG (10): | 37.8594 | |
| VORTEX (21): | 0.9173 | |
| Stochastique (14,3,5): | 24.68 | |
| TEMA (21): | 37.8031 | |
| Williams %R (14): | -70.68 | |
| Chande Momentum Oscillator (20): | -0.1446 | |
| Repulse (5,40,3): | 0.0902 | |
| ROCnROLL: | -1 | |
| TRIX (15,9): | -0.0056 | |
| Courbe Coppock: | 0.83 |
| MA7: | 37.2133 | |
| MA20: | 36.7506 | |
| MA50: | 36.2317 | |
| MA100: | 35.5218 | |
| MAexp7: | 37.8445 | |
| MAexp20: | 37.9006 | |
| MAexp50: | 37.8413 | |
| MAexp100: | 37.5917 | |
| Price / MA7: | +2.05% | |
| Price / MA20: | +3.34% | |
| Price / MA50: | +4.82% | |
| Price / MA100: | +6.91% | |
| Price / MAexp7: | +0.35% | |
| Price / MAexp20: | +0.20% | |
| Price / MAexp50: | +0.36% | |
| Price / MAexp100: | +1.02% |
News
The latest news and videos published on USD/TRY at the time of the analysis were as follows:
-
 USD/TRY Forecast July 23, 2024
-
XTB Market Updates on USDTRY - 06/06/2023
-
Upside Potential For USD/TRY
-
Upside Potential For USD/TRY
-
USD/TRY
About author
Online


Add a comment
Comments
0 comments on the analysis USD/TRY - 1H