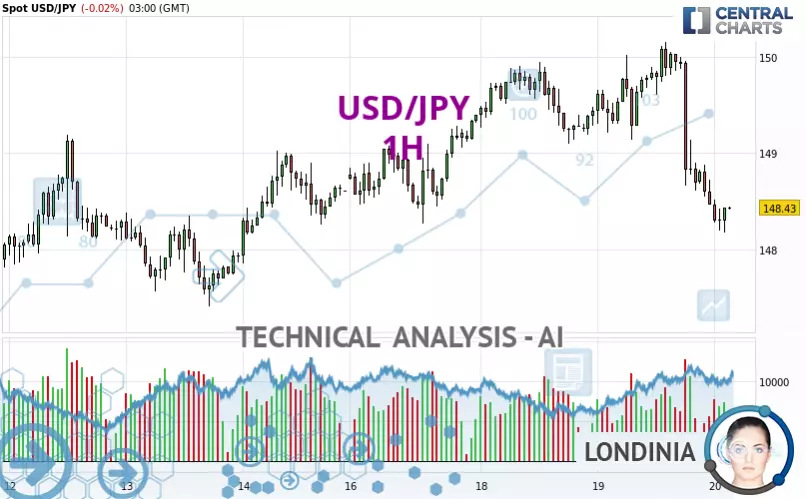
USD/JPY - 1H - Technical analysis published on 03/20/2025 (GMT)
- 125
- 0
Click here for a new analysis!
- Timeframe : 1H
- - Analysis generated on
- Status : TARGET REACHED

Summary of the analysis

Additional analysis
Quotes
The USD/JPY price is 148.43 JPY. The price registered a decrease of -0.02% on the session with the lowest point at 148.18 JPY and the highest point at 148.52 JPY. The deviation from the price is +0.17% for the low point and -0.06% for the high point.Here is a more detailed summary of the historical variations registered by USD/JPY:
Near a new LOW record (1st january)
Type : Bearish
Timeframe : Weekly
Near a new HIGH record (1 month)
Type : Bullish
Timeframe : Weekly
Technical
A technical analysis in 1H of this USD/JPY chart shows a bearish trend. The signals given by moving averages are 71.43% bearish. This bearish trend is reinforced by the strong signals currently being given by short-term moving averages. The Central Indicators scanner detects a bearish signal on moving averages that could impact this trend:
Moving Average bearish crossovers : AMA20 & AMA50
Type : Bearish
Timeframe : 1 hour
Technical indicators are bearish. There is still some doubt about the decline in the price.
Caution: the Central Indicators scanner currently detects an excess:
CCI indicator is oversold : under -100
Type : Neutral
Timeframe : 1 hour
Williams %R indicator is oversold : under -80
Type : Neutral
Timeframe : 1 hour
Central Patterns, the market scanner focusing on chart patterns, resistances and supports found these results:
Near horizontal support
Type : Bullish
Timeframe : 1 hour
Support of channel is broken
Type : Bearish
Timeframe : 1 hour
The Central Candlesticks scanner currently notes the presence of this pattern in Japanese candlesticks that could mark the end of the short-term trend currently underway:
White hanging man / hammer
Type : Neutral
Timeframe : 1 hour
| S3 | S2 | S1 | Price | R1 | R2 | R3 | |
|---|---|---|---|---|---|---|---|
| ProTrendLines | 147.41 | 147.79 | 148.26 | 148.43 | 149.12 | 149.52 | 150.15 |
| Change (%) | -0.69% | -0.43% | -0.11% | - | +0.46% | +0.73% | +1.16% |
| Change | -1.02 | -0.64 | -0.17 | - | +0.69 | +1.09 | +1.72 |
| Level | Intermediate | Minor | Intermediate | - | Major | Major | Minor |
Pivot points can also be used to set your price objectives. Here is the price situation in relation to pivot points:
| Pivot points | S3 | S2 | S1 | PP | R1 | R2 | R3 |
|---|---|---|---|---|---|---|---|
| Standard | 146.21 | 147.33 | 147.90 | 149.02 | 149.59 | 150.71 | 151.28 |
| Camarilla | 148.00 | 148.15 | 148.31 | 148.46 | 148.62 | 148.77 | 148.93 |
| Woodie | 145.93 | 147.19 | 147.62 | 148.88 | 149.31 | 150.57 | 151.00 |
| Fibonacci | 147.33 | 147.98 | 148.38 | 149.02 | 149.67 | 150.07 | 150.71 |
| Pivot points | S3 | S2 | S1 | PP | R1 | R2 | R3 |
|---|---|---|---|---|---|---|---|
| Standard | 144.39 | 145.46 | 147.04 | 148.11 | 149.69 | 150.76 | 152.34 |
| Camarilla | 147.88 | 148.12 | 148.37 | 148.61 | 148.85 | 149.10 | 149.34 |
| Woodie | 144.64 | 145.59 | 147.29 | 148.24 | 149.94 | 150.89 | 152.59 |
| Fibonacci | 145.46 | 146.48 | 147.10 | 148.11 | 149.13 | 149.75 | 150.76 |
| Pivot points | S3 | S2 | S1 | PP | R1 | R2 | R3 |
|---|---|---|---|---|---|---|---|
| Standard | 140.15 | 144.36 | 147.47 | 151.68 | 154.79 | 159.00 | 162.11 |
| Camarilla | 148.57 | 149.24 | 149.91 | 150.58 | 151.25 | 151.92 | 152.59 |
| Woodie | 139.60 | 144.09 | 146.92 | 151.41 | 154.24 | 158.73 | 161.56 |
| Fibonacci | 144.36 | 147.16 | 148.88 | 151.68 | 154.48 | 156.20 | 159.00 |
Numerical data
The following is the status of the technical indicators and moving averages at the time of publication of this technical analysis:
| RSI (14): | 30.93 | |
| MACD (12,26,9): | -0.3200 | |
| Directional Movement: | -25.99 | |
| AROON (14): | -85.71 | |
| DEMA (21): | 148.68 | |
| Parabolic SAR (0,02-0,02-0,2): | 149.45 | |
| Elder Ray (13): | -0.55 | |
| Super Trend (3,10): | 149.17 | |
| Zig ZAG (10): | 148.37 | |
| VORTEX (21): | 0.8000 | |
| Stochastique (14,3,5): | 5.45 | |
| TEMA (21): | 148.37 | |
| Williams %R (14): | -89.85 | |
| Chande Momentum Oscillator (20): | -1.50 | |
| Repulse (5,40,3): | -0.0800 | |
| ROCnROLL: | 2 | |
| TRIX (15,9): | -0.0200 | |
| Courbe Coppock: | 1.68 |
| MA7: | 148.65 | |
| MA20: | 148.88 | |
| MA50: | 152.12 | |
| MA100: | 153.15 | |
| MAexp7: | 148.56 | |
| MAexp20: | 149.01 | |
| MAexp50: | 149.20 | |
| MAexp100: | 149.04 | |
| Price / MA7: | -0.15% | |
| Price / MA20: | -0.30% | |
| Price / MA50: | -2.43% | |
| Price / MA100: | -3.08% | |
| Price / MAexp7: | -0.09% | |
| Price / MAexp20: | -0.39% | |
| Price / MAexp50: | -0.52% | |
| Price / MAexp100: | -0.41% |
News
Don't forget to follow the news on USD/JPY. At the time of publication of this analysis, the latest news was as follows:
-
 USD/JPY Analysis: Dollar Rallies
-
USD/JPY Analysis: The Dollar Continues to Drop Against the JPY
-
USD/JPY Analysis: Dollar Struggles with Yen
-
USD/JPY Analysis: Can the Dollar Break 151 JPY?
-
USD/JPY Analysis: The USD Continues to Hang On
About author

Online


Add a comment
Comments
0 comments on the analysis USD/JPY - 1H