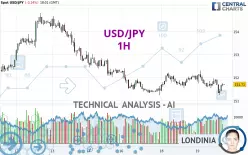
USD/JPY - 1H - Technical analysis published on 02/19/2025 (GMT)
- 70
- 0
Click here for a new analysis!
- Timeframe : 1H
- - Analysis generated on
- Status : TARGET REACHED

Summary of the analysis

Additional analysis
Quotes
USD/JPY rating 151.71 JPY. On the day, this instrument lost -0.15% with the lowest point at 151.24 JPY and the highest point at 152.31 JPY. The deviation from the price is +0.31% for the low point and -0.39% for the high point.A bearish opening was detected by the Central Gaps scanner. Sellers are trying to impose a bearish trend in the very short term.
Bearish opening
Type : Bearish
Timeframe : Openning
So that you have an overall view of the price change, here is a table showing the variations over several periods:
Near a new HIGH record (1st january)
Type : Bullish
Timeframe : Weekly
Near a new HIGH record (1 month)
Type : Bullish
Timeframe : Weekly
Technical
Technical analysis of this 1H chart of USD/JPY indicates that the overall trend is strongly bearish. 82.14% of the signals given by moving averages are bearish. The overall trend is supported by the strong bearish signals from short-term moving averages. The Central Indicators market scanner currently does not detect any result that concerns moving averages.
In fact, of the 18 technical indicators analysed by Central Analyzer, 6 are bullish, 7 are neutral and 5 are bearish. Central Indicators, the scanner specialised in technical indicators, has identified this signal:
Parabolic SAR indicator bullish reversal
Type : Bullish
Timeframe : 1 hour
The Central Patterns scanner, which studies chart patterns, resistances and supports, has identified these signals:
Near horizontal support
Type : Bullish
Timeframe : 1 hour
Near support of triangle
Type : Bullish
Timeframe : 1 hour
Support of channel is broken
Type : Bearish
Timeframe : 1 hour
No result was found by the Central Candlesticks scanner on Japanese candlesticks.
| S3 | S2 | S1 | Price | R1 | R2 | R3 | |
|---|---|---|---|---|---|---|---|
| ProTrendLines | 150.94 | 151.24 | 151.55 | 151.71 | 152.07 | 152.41 | 153.27 |
| Change (%) | -0.51% | -0.31% | -0.11% | - | +0.24% | +0.46% | +1.03% |
| Change | -0.77 | -0.47 | -0.16 | - | +0.36 | +0.70 | +1.56 |
| Level | Minor | Intermediate | Intermediate | - | Minor | Major | Intermediate |
Attention could also be paid to pivot points to set price objectives:
| Pivot points | S3 | S2 | S1 | PP | R1 | R2 | R3 |
|---|---|---|---|---|---|---|---|
| Standard | 150.69 | 151.06 | 151.49 | 151.86 | 152.29 | 152.66 | 153.09 |
| Camarilla | 151.71 | 151.78 | 151.86 | 151.93 | 152.00 | 152.08 | 152.15 |
| Woodie | 150.73 | 151.08 | 151.53 | 151.88 | 152.33 | 152.68 | 153.13 |
| Fibonacci | 151.06 | 151.36 | 151.55 | 151.86 | 152.16 | 152.35 | 152.66 |
| Pivot points | S3 | S2 | S1 | PP | R1 | R2 | R3 |
|---|---|---|---|---|---|---|---|
| Standard | 147.12 | 149.15 | 150.74 | 152.77 | 154.36 | 156.39 | 157.98 |
| Camarilla | 151.34 | 151.67 | 152.00 | 152.33 | 152.66 | 152.99 | 153.33 |
| Woodie | 146.90 | 149.04 | 150.52 | 152.66 | 154.14 | 156.28 | 157.76 |
| Fibonacci | 149.15 | 150.53 | 151.39 | 152.77 | 154.15 | 155.01 | 156.39 |
| Pivot points | S3 | S2 | S1 | PP | R1 | R2 | R3 |
|---|---|---|---|---|---|---|---|
| Standard | 147.77 | 150.74 | 152.94 | 155.91 | 158.11 | 161.08 | 163.28 |
| Camarilla | 153.72 | 154.19 | 154.67 | 155.14 | 155.61 | 156.09 | 156.56 |
| Woodie | 147.39 | 150.55 | 152.56 | 155.72 | 157.73 | 160.89 | 162.90 |
| Fibonacci | 150.74 | 152.72 | 153.94 | 155.91 | 157.89 | 159.11 | 161.08 |
Numerical data
The following are the details of the technical indicators and moving averages that were collected to generate this technical analysis:
| RSI (14): | 49.49 | |
| MACD (12,26,9): | -0.0700 | |
| Directional Movement: | -5.82 | |
| AROON (14): | -85.71 | |
| DEMA (21): | 151.66 | |
| Parabolic SAR (0,02-0,02-0,2): | 151.24 | |
| Elder Ray (13): | 0.01 | |
| Super Trend (3,10): | 152.07 | |
| Zig ZAG (10): | 151.73 | |
| VORTEX (21): | 0.9400 | |
| Stochastique (14,3,5): | 45.62 | |
| TEMA (21): | 151.61 | |
| Williams %R (14): | -30.56 | |
| Chande Momentum Oscillator (20): | -0.01 | |
| Repulse (5,40,3): | 0.1200 | |
| ROCnROLL: | -1 | |
| TRIX (15,9): | 0.0000 | |
| Courbe Coppock: | 0.39 |
| MA7: | 152.49 | |
| MA20: | 153.54 | |
| MA50: | 155.14 | |
| MA100: | 153.30 | |
| MAexp7: | 151.65 | |
| MAexp20: | 151.73 | |
| MAexp50: | 151.84 | |
| MAexp100: | 152.05 | |
| Price / MA7: | -0.51% | |
| Price / MA20: | -1.19% | |
| Price / MA50: | -2.21% | |
| Price / MA100: | -1.04% | |
| Price / MAexp7: | +0.04% | |
| Price / MAexp20: | -0.01% | |
| Price / MAexp50: | -0.09% | |
| Price / MAexp100: | -0.22% |
News
The latest news and videos published on USD/JPY at the time of the analysis were as follows:
-
 USD/JPY Analysis: US Dollar Plunges Against the Yen
-
Michael Kramer @Themarketchronicles | BoJ rate decision set to impact USD/JPY
-
USD/JPY Outlook: Can the Dollar Continue Higher?
-
USD/JPY Price Forecast - Chaos on Friday
-
USD/JPY Price Forecast - US Dollar Likely to Continue Punishing the Yen
About author

Online


Add a comment
Comments
0 comments on the analysis USD/JPY - 1H