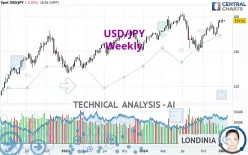
USD/JPY - Weekly - Technical analysis published on 01/13/2025 (GMT)
- 99
- 0
Click here for a new analysis!
- Timeframe : Weekly
- - Analysis generated on
- Status : INVALID

Summary of the analysis

Additional analysis
Quotes
The USD/JPY price is 157.51 JPY. The price is lower by -0.15% over the 5 days with the lowest point at 156.91 JPY and the highest point at 158.88 JPY. The deviation from the price is +0.38% for the low point and -0.86% for the high point.The Central Gaps scanner detects a bullish opening. A small advantage for buyers in the very short term.
Bullish opening
Type : Bullish
Timeframe : Openning
Here is a more detailed summary of the historical variations registered by USD/JPY:
Near a new HIGH record (5 years)
Type : Bullish
Timeframe : Weekly
Near a new HIGH record (1 year)
Type : Bullish
Timeframe : Weekly
Near a new HIGH record (1st january)
Type : Bullish
Timeframe : Weekly
Near a new LOW record (1 month)
Type : Bearish
Timeframe : Weekly
Technical
Technical analysis of this Weekly chart of USD/JPY indicates that the overall trend is strongly bullish. 89.29% of the signals given by moving averages are bullish. This strongly bullish trend is supported by the strong bullish signals given by short-term moving averages. The Central Indicators scanner does not detect any result on moving averages that would impact this trend.
In fact, 14 technical indicators on 18 studied are currently bullish. Caution: the Central Indicators scanner currently detects an excess:
Williams %R indicator is overbought : over -20
Type : Neutral
Timeframe : Weekly
Price is back under the pivot point
Type : Bearish
Timeframe : Weekly
An analysis of the price chart with the Central Patterns scanner (detector of chart patterns and resistances and supports) shows a result that can have an impact on the price change:
Near support of channel
Type : Bullish
Timeframe : Weekly
The Central Candlesticks scanner, specialised in Japanese candlesticks, did not identify any signals.
| S3 | S2 | S1 | Price | R1 | |
|---|---|---|---|---|---|
| ProTrendLines | 125.57 | 140.88 | 150.17 | 157.51 | 161.59 |
| Change (%) | -20.28% | -10.56% | -4.66% | - | +2.59% |
| Change | -31.94 | -16.63 | -7.34 | - | +4.08 |
| Level | Intermediate | Major | Major | - | Major |
To determine price objectives, it is also possible to use the pivot points. Here is the price position in relation to pivot points:
| Pivot points | S3 | S2 | S1 | PP | R1 | R2 | R3 |
|---|---|---|---|---|---|---|---|
| Standard | 155.38 | 156.31 | 157.03 | 157.96 | 158.68 | 159.61 | 160.33 |
| Camarilla | 157.31 | 157.46 | 157.61 | 157.76 | 157.91 | 158.06 | 158.21 |
| Woodie | 155.29 | 156.26 | 156.94 | 157.91 | 158.59 | 159.56 | 160.24 |
| Fibonacci | 156.31 | 156.94 | 157.33 | 157.96 | 158.59 | 158.98 | 159.61 |
| Pivot points | S3 | S2 | S1 | PP | R1 | R2 | R3 |
|---|---|---|---|---|---|---|---|
| Standard | 153.73 | 154.99 | 156.37 | 157.63 | 159.01 | 160.27 | 161.65 |
| Camarilla | 157.03 | 157.28 | 157.52 | 157.76 | 158.00 | 158.24 | 158.49 |
| Woodie | 153.80 | 155.02 | 156.44 | 157.66 | 159.08 | 160.30 | 161.72 |
| Fibonacci | 154.99 | 156.00 | 156.62 | 157.63 | 158.64 | 159.26 | 160.27 |
| Pivot points | S3 | S2 | S1 | PP | R1 | R2 | R3 |
|---|---|---|---|---|---|---|---|
| Standard | 141.77 | 145.21 | 151.22 | 154.66 | 160.67 | 164.11 | 170.12 |
| Camarilla | 154.64 | 155.51 | 156.37 | 157.24 | 158.11 | 158.97 | 159.84 |
| Woodie | 143.07 | 145.85 | 152.52 | 155.30 | 161.97 | 164.75 | 171.42 |
| Fibonacci | 145.21 | 148.82 | 151.05 | 154.66 | 158.27 | 160.50 | 164.11 |
Numerical data
The following is the status of technical indicators and moving averages registered at the time this technical analysis was created:
| RSI (14): | 60.75 | |
| MACD (12,26,9): | 1.8300 | |
| Directional Movement: | 9.47 | |
| AROON (14): | 92.86 | |
| DEMA (21): | 155.35 | |
| Parabolic SAR (0,02-0,02-0,2): | 152.78 | |
| Elder Ray (13): | 2.95 | |
| Super Trend (3,10): | 147.99 | |
| Zig ZAG (10): | 157.53 | |
| VORTEX (21): | 1.1800 | |
| Stochastique (14,3,5): | 90.76 | |
| TEMA (21): | 156.85 | |
| Williams %R (14): | -12.99 | |
| Chande Momentum Oscillator (20): | 5.22 | |
| Repulse (5,40,3): | 1.2100 | |
| ROCnROLL: | 1 | |
| TRIX (15,9): | 0.0700 | |
| Courbe Coppock: | 12.40 |
| MA7: | 157.82 | |
| MA20: | 156.82 | |
| MA50: | 154.37 | |
| MA100: | 150.41 | |
| MAexp7: | 156.13 | |
| MAexp20: | 153.42 | |
| MAexp50: | 151.24 | |
| MAexp100: | 146.76 | |
| Price / MA7: | -0.20% | |
| Price / MA20: | +0.44% | |
| Price / MA50: | +2.03% | |
| Price / MA100: | +4.72% | |
| Price / MAexp7: | +0.88% | |
| Price / MAexp20: | +2.67% | |
| Price / MAexp50: | +4.15% | |
| Price / MAexp100: | +7.32% |
News
The latest news and videos published on USD/JPY at the time of the analysis were as follows:
-
 USD/JPY Price Forecast - Chaos on Friday
-
USD/JPY Price Forecast - US Dollar Likely to Continue Punishing the Yen
-
USD/JPY Price Forecast - US Dollar Continues to Hit Ceiling (January 8, 2025 Forecast)
-
USD/JPY Price Forecast - It's Only a Matter of Time (January 6, 2025)
-
USD/JPY Forecast Can the Yen Recover Against the Dollar
About author

Online


Add a comment
Comments
0 comments on the analysis USD/JPY - Weekly