USD/JPY - 1H - Technical analysis published on 10/28/2024 (GMT)
- 145
- 0
Click here for a new analysis!
- Timeframe : 1H
- - Analysis generated on
- Status : TARGET REACHED

Summary of the analysis

Additional analysis
Quotes
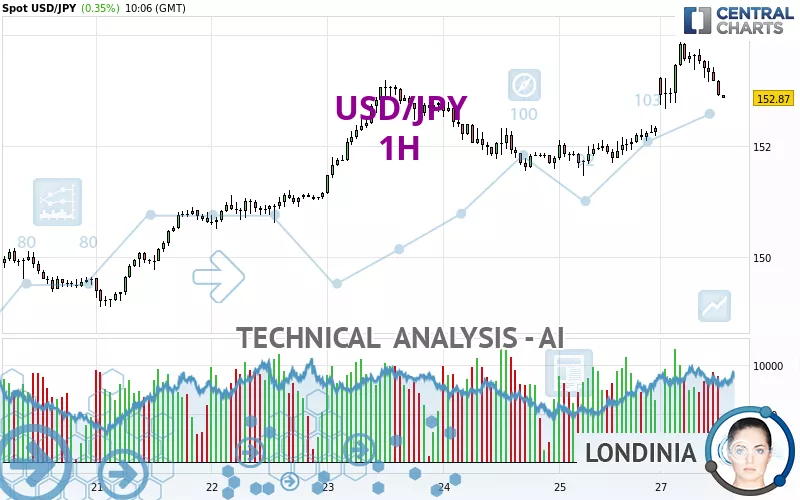
The USD/JPY rating is 152.87 JPY. The price has increased by +0.35% since the last closing with the lowest point at 152.67 JPY and the highest point at 153.88 JPY. The deviation from the price is +0.13% for the low point and -0.66% for the high point.The Central Gaps scanner detects the formation of a bullish gap marking the strong presence of buyers against sellers at the opening. This formed a quotation gap.
Opening Gap UP
Type : Bullish
Timeframe : Openning
So that you have an overall view of the price change, here is a table showing the variations over several periods:
New HIGH record (1 month)
Type : Bullish
Timeframe : Weekly
Technical
Technical analysis of this 1H chart of USD/JPY indicates that the overall trend is bullish. 75.00% of the signals given by moving averages are bullish. Caution: the neutral signals currently given by the short-term moving averages indicate that this bullish trend is showing signs of running out of steam. The Central Indicators market scanner is currently detecting a bearish signal that could impact this trend:
Bearish trend reversal : adaptative moving average 20
Type : Bearish
Timeframe : 1 hour
In fact, of the 18 technical indicators analysed by Central Analyzer, 3 are bullish, 9 are neutral and 6 are bearish. Caution: the Central Indicators scanner currently detects an excess:
Williams %R indicator is oversold : under -80
Type : Neutral
Timeframe : 1 hour
Pivot points : price is over resistance 1
Type : Neutral
Timeframe : 1 hour
An analysis of the price chart with the Central Patterns scanner (detector of chart patterns and resistances and supports) shows several results that can have an impact on the price change:
Near horizontal resistance
Type : Bearish
Timeframe : 1 hour
Resistance of channel is broken
Type : Bullish
Timeframe : 1 hour
No result was found by the Central Candlesticks scanner on Japanese candlesticks.
| S3 | S2 | S1 | Price | R1 | R2 | R3 | |
|---|---|---|---|---|---|---|---|
| ProTrendLines | 151.45 | 152.11 | 152.47 | 152.87 | 153.04 | 155.12 | 158.33 |
| Change (%) | -0.93% | -0.50% | -0.26% | - | +0.11% | +1.47% | +3.57% |
| Change | -1.42 | -0.76 | -0.40 | - | +0.17 | +2.25 | +5.46 |
| Level | Minor | Intermediate | Minor | - | Major | Minor | Intermediate |
To determine price objectives, it is also possible to use the pivot points. Here is the price position in relation to pivot points:
| Pivot points | S3 | S2 | S1 | PP | R1 | R2 | R3 |
|---|---|---|---|---|---|---|---|
| Standard | 150.80 | 151.12 | 151.73 | 152.05 | 152.66 | 152.98 | 153.59 |
| Camarilla | 152.07 | 152.16 | 152.25 | 152.33 | 152.42 | 152.50 | 152.59 |
| Woodie | 150.94 | 151.19 | 151.87 | 152.12 | 152.80 | 153.05 | 153.73 |
| Fibonacci | 151.12 | 151.48 | 151.70 | 152.05 | 152.41 | 152.63 | 152.98 |
| Pivot points | S3 | S2 | S1 | PP | R1 | R2 | R3 |
|---|---|---|---|---|---|---|---|
| Standard | 145.78 | 147.44 | 149.88 | 151.54 | 153.98 | 155.64 | 158.08 |
| Camarilla | 151.20 | 151.58 | 151.95 | 152.33 | 152.71 | 153.08 | 153.46 |
| Woodie | 146.18 | 147.64 | 150.28 | 151.74 | 154.38 | 155.84 | 158.48 |
| Fibonacci | 147.44 | 149.00 | 149.97 | 151.54 | 153.10 | 154.07 | 155.64 |
| Pivot points | S3 | S2 | S1 | PP | R1 | R2 | R3 |
|---|---|---|---|---|---|---|---|
| Standard | 132.17 | 135.87 | 139.80 | 143.50 | 147.43 | 151.13 | 155.06 |
| Camarilla | 141.62 | 142.32 | 143.02 | 143.72 | 144.42 | 145.12 | 145.82 |
| Woodie | 132.28 | 135.93 | 139.91 | 143.56 | 147.54 | 151.19 | 155.17 |
| Fibonacci | 135.87 | 138.79 | 140.59 | 143.50 | 146.42 | 148.22 | 151.13 |
Numerical data
The following is the status of the technical indicators and moving averages at the time of publication of this technical analysis:
| RSI (14): | 51.49 | |
| MACD (12,26,9): | 0.2700 | |
| Directional Movement: | 5.27 | |
| AROON (14): | 35.71 | |
| DEMA (21): | 153.36 | |
| Parabolic SAR (0,02-0,02-0,2): | 153.76 | |
| Elder Ray (13): | -0.22 | |
| Super Trend (3,10): | 152.65 | |
| Zig ZAG (10): | 152.88 | |
| VORTEX (21): | 1.0900 | |
| Stochastique (14,3,5): | 40.10 | |
| TEMA (21): | 153.45 | |
| Williams %R (14): | -81.82 | |
| Chande Momentum Oscillator (20): | -0.06 | |
| Repulse (5,40,3): | -0.2600 | |
| ROCnROLL: | -1 | |
| TRIX (15,9): | 0.0300 | |
| Courbe Coppock: | 1.14 |
| MA7: | 151.58 | |
| MA20: | 149.44 | |
| MA50: | 146.00 | |
| MA100: | 150.58 | |
| MAexp7: | 153.15 | |
| MAexp20: | 152.98 | |
| MAexp50: | 152.55 | |
| MAexp100: | 152.05 | |
| Price / MA7: | +0.85% | |
| Price / MA20: | +2.30% | |
| Price / MA50: | +4.71% | |
| Price / MA100: | +1.52% | |
| Price / MAexp7: | -0.18% | |
| Price / MAexp20: | -0.07% | |
| Price / MAexp50: | +0.21% | |
| Price / MAexp100: | +0.54% |
News
Don't forget to follow the news on USD/JPY. At the time of publication of this analysis, the latest news was as follows:
-
 USD/JPY Forecast October 18, 2024
-
USD/JPY Forecast October 16, 2024
-
USD/JPY Forecast October 15, 2024
-
USD/JPY Continues to Grind Higher for the Week: Long Term Forecast by Chris Lewis (October 11)
-
USD/JPY Continues to Show Strength: Forecast & Technical Analysis by Chris Lewis (October 09)
About author

Online


Add a comment
Comments
0 comments on the analysis USD/JPY - 1H