| Open: | - |
| Change: | - |
| Volume: | - |
| Low: | - |
| High: | - |
| High / Low range: | - |
| Type: | Forex |
| Ticker: | USDJPY |
| ISIN: |
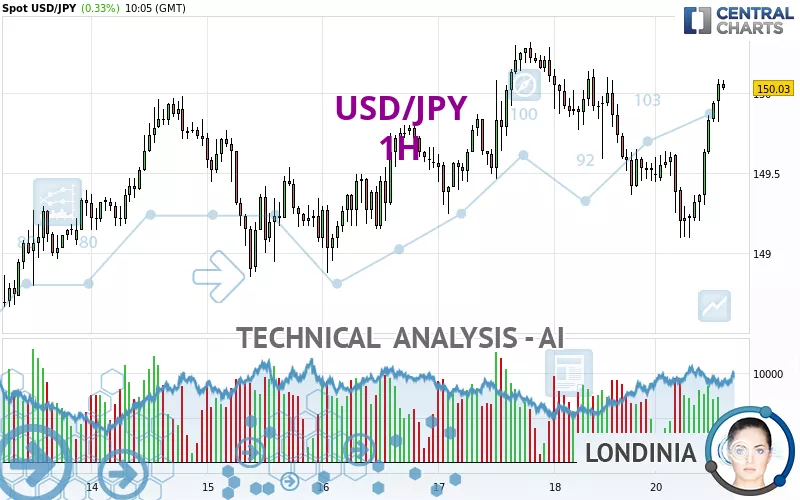
USD/JPY - 1H - Technical analysis published on 10/21/2024 (GMT)
- 106
- 0
- 10/21/2024 - 10:05
Click here for a new analysis!
- Timeframe : 1H
- - Analysis generated on 10/21/2024 - 10:05
- Status : TARGET REACHED
Summary of the analysis

Additional analysis
Quotes
USD/JPY rating 150.03 JPY. The price has increased by +0.33% since the last closing and was between 149.09 JPY and 150.09 JPY. This implies that the price is at +0.63% from its lowest and at -0.04% from its highest.The Central Gaps scanner detects a bearish opening. A small advantage for sellers in the very short term.
Bearish opening
Type : Bearish
Timeframe : Openning
A study of price movements over other periods shows the following variations:
Near a new LOW record (1 month)
Type : Bearish
Timeframe : Weekly
Technical
Technical analysis of USD/JPY in 1H shows a strongly overall bullish trend. The signals given by the moving averages are 82.14% bullish. This strong bullish trend is confirmed by the strong signals currently being given by short-term moving averages. There is no crossing of moving average by the price or crossing of moving averages between themselves.
An assessment of technical indicators shows a strong bullish signal.
Caution: the Central Indicators scanner currently detects an excess:
CCI indicator is overbought : over 100
Type : Neutral
Timeframe : 1 hour
Previous candle closed over Bollinger bands
Type : Neutral
Timeframe : 1 hour
Williams %R indicator is overbought : over -20
Type : Neutral
Timeframe : 1 hour
Pivot points : price is over resistance 1
Type : Neutral
Timeframe : 1 hour
Price is back over the pivot point
Type : Bullish
Timeframe : Weekly
The Central Patterns scanner, which studies chart patterns, resistances and supports, has identified these signals:
Near resistance of channel
Type : Bearish
Timeframe : 1 hour
Near resistance of triangle
Type : Bearish
Timeframe : 1 hour
The Central Candlesticks scanner currently notes the presence of this pattern in Japanese candlesticks that could mark the end of the short-term trend currently underway:
Doji
Type : Neutral
Timeframe : 1 hour
| S3 | S2 | S1 | Price | R1 | R2 | R3 | |
|---|---|---|---|---|---|---|---|
| ProTrendLines | 149.37 | 149.57 | 149.98 | 150.03 | 150.17 | 155.12 | 158.33 |
| Change (%) | -0.44% | -0.31% | -0.03% | - | +0.09% | +3.39% | +5.53% |
| Change | -0.66 | -0.46 | -0.05 | - | +0.14 | +5.09 | +8.30 |
| Level | Minor | Intermediate | Minor | - | Major | Minor | Minor |
To determine price objectives, it is also possible to use the pivot points. Here is the price position in relation to pivot points:
| Pivot points | S3 | S2 | S1 | PP | R1 | R2 | R3 |
|---|---|---|---|---|---|---|---|
| Standard | 148.42 | 148.89 | 149.21 | 149.68 | 150.00 | 150.47 | 150.79 |
| Camarilla | 149.31 | 149.39 | 149.46 | 149.53 | 149.60 | 149.68 | 149.75 |
| Woodie | 148.35 | 148.85 | 149.14 | 149.64 | 149.93 | 150.43 | 150.72 |
| Fibonacci | 148.89 | 149.19 | 149.38 | 149.68 | 149.98 | 150.17 | 150.47 |
| Pivot points | S3 | S2 | S1 | PP | R1 | R2 | R3 |
|---|---|---|---|---|---|---|---|
| Standard | 147.34 | 148.10 | 148.81 | 149.57 | 150.28 | 151.04 | 151.75 |
| Camarilla | 149.13 | 149.26 | 149.40 | 149.53 | 149.67 | 149.80 | 149.93 |
| Woodie | 147.33 | 148.09 | 148.80 | 149.56 | 150.27 | 151.03 | 151.74 |
| Fibonacci | 148.10 | 148.66 | 149.01 | 149.57 | 150.13 | 150.48 | 151.04 |
| Pivot points | S3 | S2 | S1 | PP | R1 | R2 | R3 |
|---|---|---|---|---|---|---|---|
| Standard | 132.17 | 135.87 | 139.80 | 143.50 | 147.43 | 151.13 | 155.06 |
| Camarilla | 141.62 | 142.32 | 143.02 | 143.72 | 144.42 | 145.12 | 145.82 |
| Woodie | 132.28 | 135.93 | 139.91 | 143.56 | 147.54 | 151.19 | 155.17 |
| Fibonacci | 135.87 | 138.79 | 140.59 | 143.50 | 146.42 | 148.22 | 151.13 |
Numerical data
The following is the status of technical indicators and moving averages registered at the time this technical analysis was created:
| RSI (14): | 66.42 | |
| MACD (12,26,9): | 0.0400 | |
| Directional Movement: | 13.42 | |
| AROON (14): | 57.15 | |
| DEMA (21): | 149.68 | |
| Parabolic SAR (0,02-0,02-0,2): | 149.25 | |
| Elder Ray (13): | 0.36 | |
| Super Trend (3,10): | 149.48 | |
| Zig ZAG (10): | 150.06 | |
| VORTEX (21): | 1.1100 | |
| Stochastique (14,3,5): | 97.28 | |
| TEMA (21): | 149.76 | |
| Williams %R (14): | -4.00 | |
| Chande Momentum Oscillator (20): | 0.47 | |
| Repulse (5,40,3): | 0.2400 | |
| ROCnROLL: | 1 | |
| TRIX (15,9): | -0.0100 | |
| Courbe Coppock: | 0.28 |
| MA7: | 149.60 | |
| MA20: | 147.29 | |
| MA50: | 145.52 | |
| MA100: | 150.77 | |
| MAexp7: | 149.81 | |
| MAexp20: | 149.67 | |
| MAexp50: | 149.68 | |
| MAexp100: | 149.59 | |
| Price / MA7: | +0.29% | |
| Price / MA20: | +1.86% | |
| Price / MA50: | +3.10% | |
| Price / MA100: | -0.49% | |
| Price / MAexp7: | +0.15% | |
| Price / MAexp20: | +0.24% | |
| Price / MAexp50: | +0.23% | |
| Price / MAexp100: | +0.29% |
News
The latest news and videos published on USD/JPY at the time of the analysis were as follows:
-
10/17/2024 - 17:47
 USD/JPY Forecast October 18, 2024
-
10/15/2024 - 16:01
USD/JPY Forecast October 16, 2024
-
10/14/2024 - 18:01
USD/JPY Forecast October 15, 2024
-
10/11/2024 - 15:48
USD/JPY Continues to Grind Higher for the Week: Long Term Forecast by Chris Lewis (October 11)
-
10/09/2024 - 12:48
USD/JPY Continues to Show Strength: Forecast & Technical Analysis by Chris Lewis (October 09)
About author

Online


Add a comment
Comments
0 comments on the analysis USD/JPY - 1H