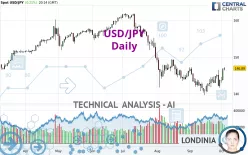
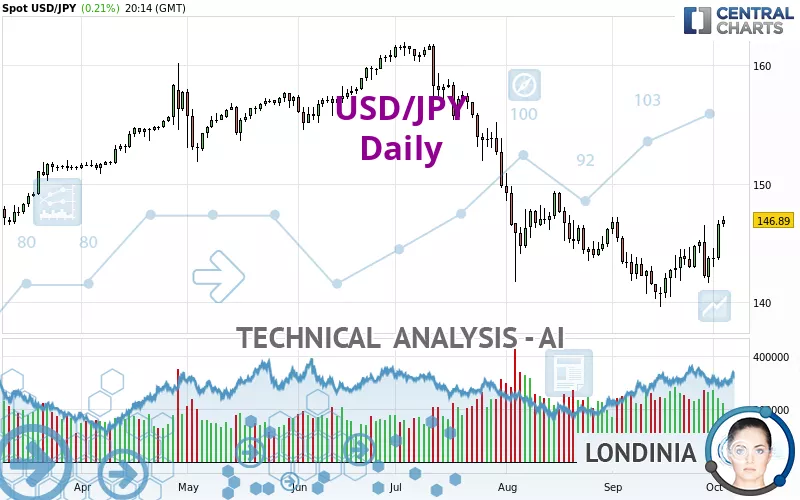
USD/JPY - Daily - Technical analysis published on 10/03/2024 (GMT)
- 151
- 0
Click here for a new analysis!
- Timeframe : Daily
- - Analysis generated on
- Status : TARGET REACHED
Summary of the analysis

Additional analysis
Quotes
USD/JPY rating 146.89 JPY. The price registered an increase of +0.21% on the session and was between 146.30 JPY and 147.24 JPY. This implies that the price is at +0.40% from its lowest and at -0.24% from its highest.The Central Gaps scanner detects a bearish opening marking the presence of sellers ahead of buyers at the opening but not sufficiently marked to allow the price to register a quotation gap.
Bearish opening
Type : Bearish
Timeframe : Openning
So that you have an overall view of the price change, here is a table showing the variations over several periods:
Near a new LOW record (1 year)
Type : Bearish
Timeframe : Weekly
Near a new LOW record (1st january)
Type : Bearish
Timeframe : Weekly
New HIGH record (1 month)
Type : Bullish
Timeframe : Weekly
Technical
Technical analysis of this Daily chart of USD/JPY indicates that the overall trend is slightly bearish. Only 57.14% of the signals given by moving averages are bearish. This slightly bearish trend could quickly be reversed due to the strong bullish signals currently being given by short-term moving averages. An assessment of moving averages reveals several bullish signals that could impact this trend:
Bullish trend reversal : Moving Average 20
Type : Bullish
Timeframe : Daily
Bullish trend reversal : adaptative moving average 50
Type : Bullish
Timeframe : Daily
In fact, 13 technical indicators on 18 studied are currently positioned bullish. Caution: the Central Indicators scanner currently detects an excess:
CCI indicator is overbought : over 100
Type : Neutral
Timeframe : Daily
Previous candle closed over Bollinger bands
Type : Neutral
Timeframe : Daily
Williams %R indicator is overbought : over -20
Type : Neutral
Timeframe : Daily
Pivot points : price is over resistance 1
Type : Neutral
Timeframe : Weekly
The Central Patterns scanner, which studies chart patterns, resistances and supports, has identified this signal:
Near resistance of channel
Type : Bearish
Timeframe : Daily
No result was found by the Central Candlesticks scanner on Japanese candlesticks.
| S3 | S2 | S1 | Price | R1 | R2 | R3 | |
|---|---|---|---|---|---|---|---|
| ProTrendLines | 125.57 | 141.03 | 146.75 | 146.89 | 150.17 | 158.33 | 161.59 |
| Change (%) | -14.51% | -3.99% | -0.10% | - | +2.23% | +7.79% | +10.01% |
| Change | -21.32 | -5.86 | -0.14 | - | +3.28 | +11.44 | +14.70 |
| Level | Major | Major | Major | - | Major | Minor | Intermediate |
Pivot points can also be used to set your price objectives. Here is the price situation in relation to pivot points:
| Pivot points | S3 | S2 | S1 | PP | R1 | R2 | R3 |
|---|---|---|---|---|---|---|---|
| Standard | 141.06 | 142.29 | 144.44 | 145.67 | 147.82 | 149.05 | 151.20 |
| Camarilla | 145.65 | 145.96 | 146.27 | 146.58 | 146.89 | 147.20 | 147.51 |
| Woodie | 141.51 | 142.52 | 144.89 | 145.90 | 148.27 | 149.28 | 151.65 |
| Fibonacci | 142.29 | 143.58 | 144.38 | 145.67 | 146.96 | 147.76 | 149.05 |
| Pivot points | S3 | S2 | S1 | PP | R1 | R2 | R3 |
|---|---|---|---|---|---|---|---|
| Standard | 136.26 | 139.17 | 140.68 | 143.59 | 145.10 | 148.01 | 149.52 |
| Camarilla | 140.99 | 141.39 | 141.80 | 142.20 | 142.61 | 143.01 | 143.42 |
| Woodie | 135.57 | 138.82 | 139.99 | 143.24 | 144.41 | 147.66 | 148.83 |
| Fibonacci | 139.17 | 140.86 | 141.90 | 143.59 | 145.28 | 146.32 | 148.01 |
| Pivot points | S3 | S2 | S1 | PP | R1 | R2 | R3 |
|---|---|---|---|---|---|---|---|
| Standard | 132.17 | 135.87 | 139.80 | 143.50 | 147.43 | 151.13 | 155.06 |
| Camarilla | 141.62 | 142.32 | 143.02 | 143.72 | 144.42 | 145.12 | 145.82 |
| Woodie | 132.28 | 135.93 | 139.91 | 143.56 | 147.54 | 151.19 | 155.17 |
| Fibonacci | 135.87 | 138.79 | 140.59 | 143.50 | 146.42 | 148.22 | 151.13 |
Numerical data
The following are the details of the technical indicators and moving averages that were collected to generate this technical analysis:
| RSI (14): | 59.18 | |
| MACD (12,26,9): | -0.0600 | |
| Directional Movement: | 2.31 | |
| AROON (14): | 92.86 | |
| DEMA (21): | 143.72 | |
| Parabolic SAR (0,02-0,02-0,2): | 141.76 | |
| Elder Ray (13): | 2.46 | |
| Super Trend (3,10): | 140.63 | |
| Zig ZAG (10): | 146.88 | |
| VORTEX (21): | 1.0800 | |
| Stochastique (14,3,5): | 83.62 | |
| TEMA (21): | 145.12 | |
| Williams %R (14): | -4.70 | |
| Chande Momentum Oscillator (20): | 4.87 | |
| Repulse (5,40,3): | 1.9500 | |
| ROCnROLL: | -1 | |
| TRIX (15,9): | -0.0700 | |
| Courbe Coppock: | 3.68 |
| MA7: | 144.70 | |
| MA20: | 143.22 | |
| MA50: | 145.40 | |
| MA100: | 151.68 | |
| MAexp7: | 144.95 | |
| MAexp20: | 144.21 | |
| MAexp50: | 146.23 | |
| MAexp100: | 148.83 | |
| Price / MA7: | +1.51% | |
| Price / MA20: | +2.56% | |
| Price / MA50: | +1.02% | |
| Price / MA100: | -3.16% | |
| Price / MAexp7: | +1.34% | |
| Price / MAexp20: | +1.86% | |
| Price / MAexp50: | +0.45% | |
| Price / MAexp100: | -1.30% |
News
The latest news and videos published on USD/JPY at the time of the analysis were as follows:
-
 USD/JPY Continues to Reach Higher: Forecast & Technical Analysis by Chris Lewis (October 03)
-
USD/JPY Rallies but Gives Up Gains: Forecast & Technical Analysis by Chris Lewis (October 01)
-
USD/JPY Pulls Back from Crucial Level: Forecast & Technical Analysis by Chris Lewis (September 26)
-
USD/JPY Forecast September 25, 2024
-
Dollar Finds Support Against Yen: USD/JPY Forecast & Technical Analysis for by Chris Lewis (09/18)
About author

Online


Add a comment
Comments
0 comments on the analysis USD/JPY - Daily