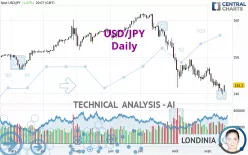
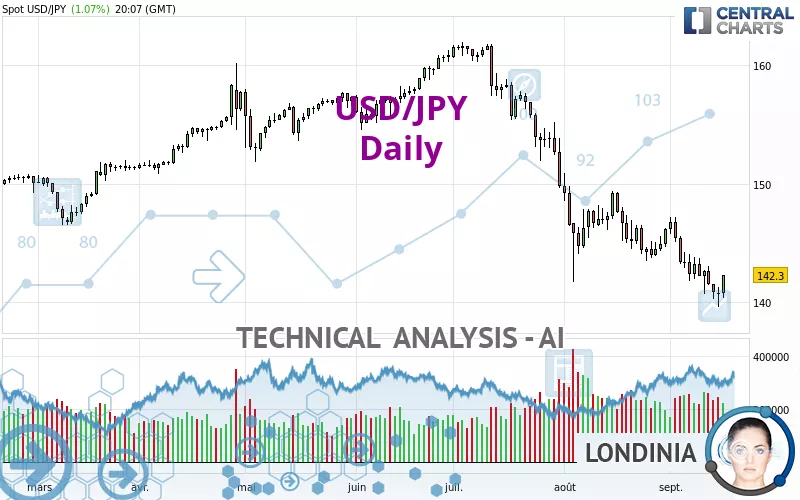
USD/JPY - Daily - Technical analysis published on 09/17/2024 (GMT)
- 150
- 0
Click here for a new analysis!
- Timeframe : Daily
- - Analysis generated on
- Status : INVALID
Summary of the analysis

Additional analysis
Quotes
The USD/JPY price is 142.30 JPY. On the day, this instrument gained +1.07% with the lowest point at 140.32 JPY and the highest point at 142.31 JPY. The deviation from the price is +1.41% for the low point and -0.01% for the high point.Here is a more detailed summary of the historical variations registered by USD/JPY:
Near a new LOW record (1 year)
Type : Bearish
Timeframe : Weekly
Near a new LOW record (1st january)
Type : Bearish
Timeframe : Weekly
Near a new HIGH record (1 month)
Type : Bullish
Timeframe : Weekly
Technical
A technical analysis in Daily of this USD/JPY chart shows a sharp bearish trend. 92.86% of the signals given by moving averages are bearish. This strongly bearish trend is supported by the strong bearish signals given by short-term moving averages. The Central Indicators market scanner currently does not detect any result that concerns moving averages.
On the 18 technical indicators analysed, 6 are bullish, 4 are neutral and 8 are bearish. Other results related to technical indicators were also found by the Central Indicators scanner:
Pivot points : price is over resistance 2
Type : Neutral
Timeframe : Daily
MACD crosses UP its Moving Average
Type : Bullish
Timeframe : Daily
Price is back over the pivot point
Type : Bullish
Timeframe : Weekly
Central Patterns, the market scanner focusing on chart patterns, resistances and supports found this result:
Near support of channel
Type : Bullish
Timeframe : Daily
The Central Candlesticks scanner, specialised in Japanese candlesticks, did not identify any signals.
| S3 | S2 | S1 | Price | R1 | R2 | R3 | |
|---|---|---|---|---|---|---|---|
| ProTrendLines | 116.13 | 125.57 | 141.03 | 142.30 | 146.75 | 150.17 | 161.59 |
| Change (%) | -18.39% | -11.76% | -0.89% | - | +3.13% | +5.53% | +13.56% |
| Change | -26.17 | -16.73 | -1.27 | - | +4.45 | +7.87 | +19.29 |
| Level | Minor | Major | Major | - | Intermediate | Major | Major |
To determine price objectives, it is also possible to use the pivot points. Here is the price position in relation to pivot points:
| Pivot points | S3 | S2 | S1 | PP | R1 | R2 | R3 |
|---|---|---|---|---|---|---|---|
| Standard | 138.18 | 138.88 | 139.84 | 140.54 | 141.50 | 142.20 | 143.16 |
| Camarilla | 140.34 | 140.50 | 140.65 | 140.80 | 140.95 | 141.10 | 141.26 |
| Woodie | 138.31 | 138.95 | 139.97 | 140.61 | 141.63 | 142.27 | 143.29 |
| Fibonacci | 138.88 | 139.51 | 139.91 | 140.54 | 141.17 | 141.57 | 142.20 |
| Pivot points | S3 | S2 | S1 | PP | R1 | R2 | R3 |
|---|---|---|---|---|---|---|---|
| Standard | 135.95 | 138.12 | 139.47 | 141.64 | 142.99 | 145.16 | 146.51 |
| Camarilla | 139.86 | 140.19 | 140.51 | 140.83 | 141.15 | 141.48 | 141.80 |
| Woodie | 135.55 | 137.92 | 139.07 | 141.44 | 142.59 | 144.96 | 146.11 |
| Fibonacci | 138.12 | 139.46 | 140.29 | 141.64 | 142.98 | 143.81 | 145.16 |
| Pivot points | S3 | S2 | S1 | PP | R1 | R2 | R3 |
|---|---|---|---|---|---|---|---|
| Standard | 132.42 | 137.05 | 141.62 | 146.25 | 150.82 | 155.45 | 160.02 |
| Camarilla | 143.65 | 144.49 | 145.34 | 146.18 | 147.02 | 147.87 | 148.71 |
| Woodie | 132.38 | 137.04 | 141.58 | 146.24 | 150.78 | 155.44 | 159.98 |
| Fibonacci | 137.05 | 140.57 | 142.74 | 146.25 | 149.77 | 151.94 | 155.45 |
Numerical data
The following is the status of technical indicators and moving averages registered at the time this technical analysis was created:
| RSI (14): | 38.83 | |
| MACD (12,26,9): | -1.9400 | |
| Directional Movement: | -17.26 | |
| AROON (14): | -64.29 | |
| DEMA (21): | 141.08 | |
| Parabolic SAR (0,02-0,02-0,2): | 144.16 | |
| Elder Ray (13): | -1.49 | |
| Super Trend (3,10): | 145.72 | |
| Zig ZAG (10): | 142.23 | |
| VORTEX (21): | 0.8700 | |
| Stochastique (14,3,5): | 19.55 | |
| TEMA (21): | 141.18 | |
| Williams %R (14): | -65.27 | |
| Chande Momentum Oscillator (20): | -3.95 | |
| Repulse (5,40,3): | 1.2700 | |
| ROCnROLL: | 2 | |
| TRIX (15,9): | -0.1900 | |
| Courbe Coppock: | 4.50 |
| MA7: | 141.92 | |
| MA20: | 143.72 | |
| MA50: | 148.53 | |
| MA100: | 152.99 | |
| MAexp7: | 142.00 | |
| MAexp20: | 143.76 | |
| MAexp50: | 147.49 | |
| MAexp100: | 150.13 | |
| Price / MA7: | +0.27% | |
| Price / MA20: | -0.99% | |
| Price / MA50: | -4.19% | |
| Price / MA100: | -6.99% | |
| Price / MAexp7: | +0.21% | |
| Price / MAexp20: | -1.02% | |
| Price / MAexp50: | -3.52% | |
| Price / MAexp100: | -5.22% |
News
The latest news and videos published on USD/JPY at the time of the analysis were as follows:
-
 USD/JPY Forecast September 16, 2024
-
USD/JPY Continues to Test Trendlines: Long Term Forecast by Chris Lewis (September 13)
-
Dollar Stabilizes Against the Yen: USD/JPY Forecast & Technical Analysis for by Chris Lewis (09/12)
-
USD/JPY Continues to See Pressures: Forecast & Technical Analysis by Chris Lewis (September 11)
-
USD/JPY Continues to Consolidate: Forecast & Technical Analysis by Chris Lewis (August 21)
About author

Online


Add a comment
Comments
0 comments on the analysis USD/JPY - Daily