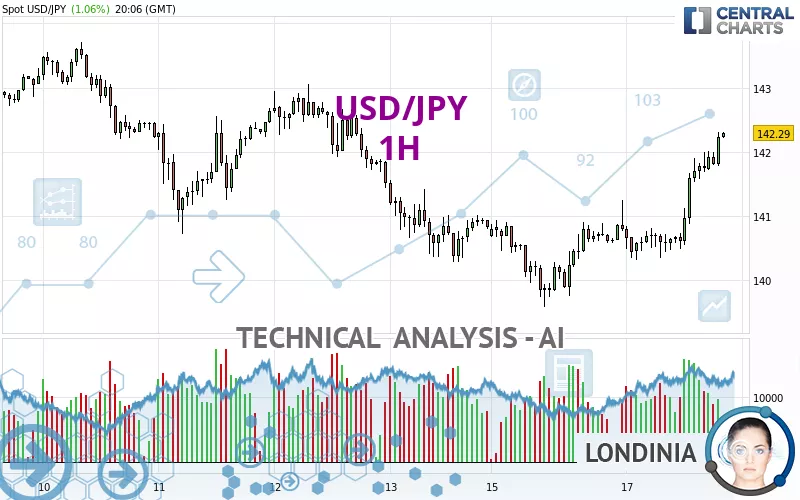
USD/JPY - 1H - Technical analysis published on 09/17/2024 (GMT)
- 111
- 0
Click here for a new analysis!
- Timeframe : 1H
- - Analysis generated on
- Status : INVALID

Summary of the analysis

Additional analysis
Quotes
The USD/JPY rating is 142.29 JPY. On the day, this instrument gained +1.06% and was traded between 140.32 JPY and 142.30 JPY over the period. The price is currently at +1.40% from its lowest and -0.01% from its highest.So that you have an overall view of the price change, here is a table showing the variations over several periods:
Near a new LOW record (1 year)
Type : Bearish
Timeframe : Weekly
Near a new LOW record (1st january)
Type : Bearish
Timeframe : Weekly
Near a new HIGH record (1 month)
Type : Bullish
Timeframe : Weekly
Technical
Technical analysis of USD/JPY in 1H shows an overall bullish trend. The signals returned by the moving averages are 78.57% bullish. This bullish trend is reinforced by the strong signals currently being given by short-term moving averages. The Central Indicators scanner does not detect any result on moving averages that would impact this trend.
Technical indicators are strongly bullish, suggesting that the price increase should continue.
But beware of excesses. The Central Indicators scanner currently detects this:
RSI indicator is overbought : over 70
Type : Neutral
Timeframe : 1 hour
CCI indicator is overbought : over 100
Type : Neutral
Timeframe : 1 hour
Williams %R indicator is overbought : over -20
Type : Neutral
Timeframe : 1 hour
Pivot points : price is over resistance 2
Type : Neutral
Timeframe : 1 hour
Price is back over the pivot point
Type : Bullish
Timeframe : Weekly
The Central Patterns scanner, which studies chart patterns, resistances and supports, has identified these signals:
Near horizontal resistance
Type : Bearish
Timeframe : 1 hour
Resistance of channel is broken
Type : Bullish
Timeframe : 1 hour
No result was found by the Central Candlesticks scanner on Japanese candlesticks.
| S3 | S2 | S1 | Price | R1 | R2 | R3 | |
|---|---|---|---|---|---|---|---|
| ProTrendLines | 140.28 | 141.03 | 141.77 | 142.29 | 143.05 | 143.79 | 146.75 |
| Change (%) | -1.41% | -0.89% | -0.37% | - | +0.53% | +1.05% | +3.13% |
| Change | -2.01 | -1.26 | -0.52 | - | +0.76 | +1.50 | +4.46 |
| Level | Minor | Major | Intermediate | - | Intermediate | Minor | Intermediate |
To determine price objectives, it is also possible to use the pivot points. Here is the price position in relation to pivot points:
| Pivot points | S3 | S2 | S1 | PP | R1 | R2 | R3 |
|---|---|---|---|---|---|---|---|
| Standard | 138.18 | 138.88 | 139.84 | 140.54 | 141.50 | 142.20 | 143.16 |
| Camarilla | 140.34 | 140.50 | 140.65 | 140.80 | 140.95 | 141.10 | 141.26 |
| Woodie | 138.31 | 138.95 | 139.97 | 140.61 | 141.63 | 142.27 | 143.29 |
| Fibonacci | 138.88 | 139.51 | 139.91 | 140.54 | 141.17 | 141.57 | 142.20 |
| Pivot points | S3 | S2 | S1 | PP | R1 | R2 | R3 |
|---|---|---|---|---|---|---|---|
| Standard | 135.95 | 138.12 | 139.47 | 141.64 | 142.99 | 145.16 | 146.51 |
| Camarilla | 139.86 | 140.19 | 140.51 | 140.83 | 141.15 | 141.48 | 141.80 |
| Woodie | 135.55 | 137.92 | 139.07 | 141.44 | 142.59 | 144.96 | 146.11 |
| Fibonacci | 138.12 | 139.46 | 140.29 | 141.64 | 142.98 | 143.81 | 145.16 |
| Pivot points | S3 | S2 | S1 | PP | R1 | R2 | R3 |
|---|---|---|---|---|---|---|---|
| Standard | 132.42 | 137.05 | 141.62 | 146.25 | 150.82 | 155.45 | 160.02 |
| Camarilla | 143.65 | 144.49 | 145.34 | 146.18 | 147.02 | 147.87 | 148.71 |
| Woodie | 132.38 | 137.04 | 141.58 | 146.24 | 150.78 | 155.44 | 159.98 |
| Fibonacci | 137.05 | 140.57 | 142.74 | 146.25 | 149.77 | 151.94 | 155.45 |
Numerical data
The following are the details of the technical indicators and moving averages that were collected to generate this technical analysis:
| RSI (14): | 77.50 | |
| MACD (12,26,9): | 0.3600 | |
| Directional Movement: | 25.44 | |
| AROON (14): | 85.71 | |
| DEMA (21): | 141.67 | |
| Parabolic SAR (0,02-0,02-0,2): | 140.93 | |
| Elder Ray (13): | 0.57 | |
| Super Trend (3,10): | 141.03 | |
| Zig ZAG (10): | 142.23 | |
| VORTEX (21): | 1.1700 | |
| Stochastique (14,3,5): | 92.78 | |
| TEMA (21): | 141.98 | |
| Williams %R (14): | -3.08 | |
| Chande Momentum Oscillator (20): | 1.63 | |
| Repulse (5,40,3): | 0.4100 | |
| ROCnROLL: | 1 | |
| TRIX (15,9): | 0.0200 | |
| Courbe Coppock: | 1.59 |
| MA7: | 141.92 | |
| MA20: | 143.72 | |
| MA50: | 148.53 | |
| MA100: | 152.99 | |
| MAexp7: | 141.75 | |
| MAexp20: | 141.25 | |
| MAexp50: | 141.01 | |
| MAexp100: | 141.27 | |
| Price / MA7: | +0.26% | |
| Price / MA20: | -0.99% | |
| Price / MA50: | -4.20% | |
| Price / MA100: | -6.99% | |
| Price / MAexp7: | +0.38% | |
| Price / MAexp20: | +0.74% | |
| Price / MAexp50: | +0.91% | |
| Price / MAexp100: | +0.72% |
News
The latest news and videos published on USD/JPY at the time of the analysis were as follows:
-
 USD/JPY Forecast September 16, 2024
-
USD/JPY Continues to Test Trendlines: Long Term Forecast by Chris Lewis (September 13)
-
Dollar Stabilizes Against the Yen: USD/JPY Forecast & Technical Analysis for by Chris Lewis (09/12)
-
USD/JPY Continues to See Pressures: Forecast & Technical Analysis by Chris Lewis (September 11)
-
USD/JPY Continues to Consolidate: Forecast & Technical Analysis by Chris Lewis (August 21)
About author

Online


Add a comment
Comments
0 comments on the analysis USD/JPY - 1H