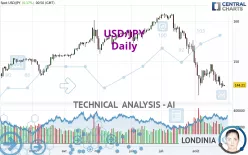
USD/JPY - Daily - Technical analysis published on 08/28/2024 (GMT)
- 161
- 0
Click here for a new analysis!
- Timeframe : Daily
- - Analysis generated on
- Status : TARGET REACHED

Summary of the analysis

Additional analysis
Quotes
USD/JPY rating 144.21 JPY. The price registered an increase of +0.17% on the session with the lowest point at 143.91 JPY and the highest point at 144.22 JPY. The deviation from the price is +0.21% for the low point and -0.01% for the high point.The Central Gaps scanner detects a bullish opening. A small advantage for buyers in the very short term.
Bullish opening
Type : Bullish
Timeframe : Openning
Here is a more detailed summary of the historical variations registered by USD/JPY:
Near a new LOW record (1 year)
Type : Bearish
Timeframe : Weekly
Near a new LOW record (1st january)
Type : Bearish
Timeframe : Weekly
Near a new LOW record (1 month)
Type : Bearish
Timeframe : Weekly
Technical
Technical analysis of this Daily chart of USD/JPY indicates that the overall trend is strongly bearish. 92.86% of the signals given by moving averages are bearish. This strongly bearish trend is supported by the strong bearish signals given by short-term moving averages. The Central Indicators scanner does not detect any result on moving averages that would impact this trend.
On the 18 technical indicators analysed, 5 are bullish, 5 are neutral and 8 are bearish. Caution: the Central Indicators scanner currently detects an excess:
CCI indicator is oversold : under -100
Type : Neutral
Timeframe : Daily
MACD indicator: bullish divergence
Type : Bullish
Timeframe : Daily
RSI indicator: bullish divergence
Type : Bullish
Timeframe : Daily
Williams %R indicator is oversold : under -80
Type : Neutral
Timeframe : Daily
The analysis of the price chart with Central Patterns scanners does not return any result.
For a small rebound in the very short term, the Central Candlesticks scanner currently notes the presence of these bullish patterns in Japanese candlesticks:
Bullish harami
Type : Bullish
Timeframe : Daily
Bullish harami cross
Type : Bullish
Timeframe : Daily
| S3 | S2 | S1 | Price | R1 | R2 | R3 | |
|---|---|---|---|---|---|---|---|
| ProTrendLines | 116.13 | 125.57 | 141.03 | 144.21 | 144.24 | 146.75 | 150.17 |
| Change (%) | -19.47% | -12.93% | -2.21% | - | +0.02% | +1.76% | +4.13% |
| Change | -28.08 | -18.64 | -3.18 | - | +0.03 | +2.54 | +5.96 |
| Level | Minor | Major | Major | - | Intermediate | Minor | Major |
Attention could also be paid to pivot points to set price objectives:
| Pivot points | S3 | S2 | S1 | PP | R1 | R2 | R3 |
|---|---|---|---|---|---|---|---|
| Standard | 141.87 | 142.77 | 143.37 | 144.27 | 144.87 | 145.77 | 146.37 |
| Camarilla | 143.55 | 143.69 | 143.82 | 143.96 | 144.10 | 144.24 | 144.37 |
| Woodie | 141.71 | 142.70 | 143.21 | 144.20 | 144.71 | 145.70 | 146.21 |
| Fibonacci | 142.77 | 143.35 | 143.70 | 144.27 | 144.85 | 145.20 | 145.77 |
| Pivot points | S3 | S2 | S1 | PP | R1 | R2 | R3 |
|---|---|---|---|---|---|---|---|
| Standard | 138.94 | 141.49 | 142.94 | 145.49 | 146.94 | 149.49 | 150.94 |
| Camarilla | 143.28 | 143.65 | 144.01 | 144.38 | 144.75 | 145.11 | 145.48 |
| Woodie | 138.38 | 141.22 | 142.38 | 145.22 | 146.38 | 149.22 | 150.38 |
| Fibonacci | 141.49 | 143.02 | 143.97 | 145.49 | 147.02 | 147.97 | 149.49 |
| Pivot points | S3 | S2 | S1 | PP | R1 | R2 | R3 |
|---|---|---|---|---|---|---|---|
| Standard | 133.25 | 141.43 | 145.61 | 153.79 | 157.97 | 166.15 | 170.33 |
| Camarilla | 146.39 | 147.52 | 148.66 | 149.79 | 150.92 | 152.06 | 153.19 |
| Woodie | 131.25 | 140.43 | 143.61 | 152.79 | 155.97 | 165.15 | 168.33 |
| Fibonacci | 141.43 | 146.15 | 149.07 | 153.79 | 158.51 | 161.43 | 166.15 |
Numerical data
The following are the details of the technical indicators and moving averages that were collected to generate this technical analysis:
| RSI (14): | 31.95 | |
| MACD (12,26,9): | -2.4100 | |
| Directional Movement: | -18.70 | |
| AROON (14): | -50.00 | |
| DEMA (21): | 143.79 | |
| Parabolic SAR (0,02-0,02-0,2): | 149.16 | |
| Elder Ray (13): | -1.82 | |
| Super Trend (3,10): | 149.66 | |
| Zig ZAG (10): | 144.11 | |
| VORTEX (21): | 0.8200 | |
| Stochastique (14,3,5): | 12.75 | |
| TEMA (21): | 143.41 | |
| Williams %R (14): | -87.75 | |
| Chande Momentum Oscillator (20): | -2.83 | |
| Repulse (5,40,3): | -0.5200 | |
| ROCnROLL: | 2 | |
| TRIX (15,9): | -0.2500 | |
| Courbe Coppock: | 2.97 |
| MA7: | 144.81 | |
| MA20: | 146.27 | |
| MA50: | 153.39 | |
| MA100: | 154.65 | |
| MAexp7: | 144.91 | |
| MAexp20: | 147.09 | |
| MAexp50: | 150.83 | |
| MAexp100: | 152.39 | |
| Price / MA7: | -0.41% | |
| Price / MA20: | -1.41% | |
| Price / MA50: | -5.98% | |
| Price / MA100: | -6.75% | |
| Price / MAexp7: | -0.48% | |
| Price / MAexp20: | -1.96% | |
| Price / MAexp50: | -4.39% | |
| Price / MAexp100: | -5.37% |
News
Don't forget to follow the news on USD/JPY. At the time of publication of this analysis, the latest news was as follows:
-
 USD/JPY Continues to Consolidate: Forecast & Technical Analysis by Chris Lewis (August 21)
-
USD/JPY Recovers a Bit Against The Yen: Long Term Forecast by Chris Lewis (August 16)
-
USD/JPY Pulls Back Against Yen: Forecast & Technical Analysis by Chris Lewis (August 16)
-
USD/JPY Explodes to the Upside: Forecast & Technical Analysis by Chris Lewis (August 15)
-
USD/JPY Continues to Test Resistance: Forecast & Technical Analysis by Chris Lewis (August 13)
About author

Online


Add a comment
Comments
0 comments on the analysis USD/JPY - Daily