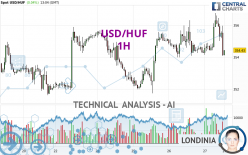
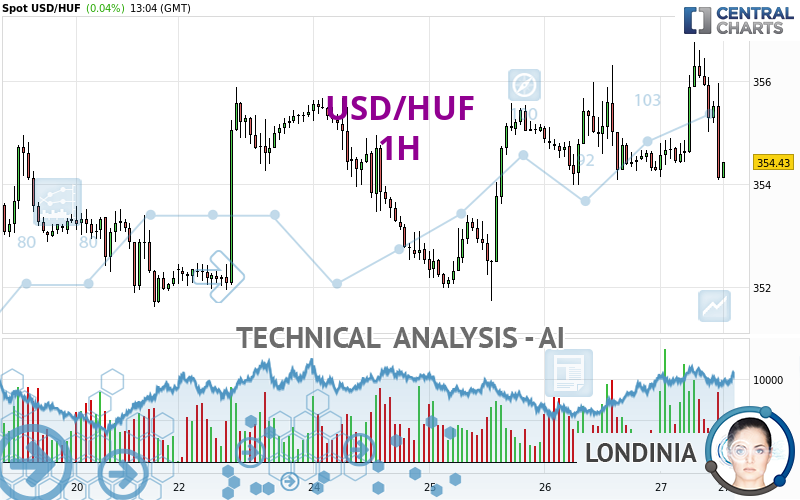
USD/HUF - 1H - Technical analysis published on 09/27/2024 (GMT)
- 74
- 0
- Timeframe : 1H
- - Analysis generated on
- Status : NEUTRAL
Summary of the analysis

Additional analysis
Quotes
The USD/HUF price is 354.42 HUF. On the day, this instrument gained +0.04% and was traded between 354.08 HUF and 356.75 HUF over the period. The price is currently at +0.10% from its lowest and -0.65% from its highest.A study of price movements over other periods shows the following variations:
Near a new HIGH record (1 year)
Type : Bullish
Timeframe : Weekly
Near a new HIGH record (1st january)
Type : Bullish
Timeframe : Weekly
Near a new HIGH record (1 month)
Type : Bullish
Timeframe : Weekly
Technical
Technical analysis of USD/HUF in 1H shows an overall slightly bullish trend. 50.00% of the signals given by moving averages are bullish. Caution: the slightly bearish signals currently given by short-term moving averages indicate that the overall trend could be reversed. The Central Indicators market scanner is currently detecting several bearish signals that could impact this trend:
Bearish trend reversal : Moving Average 20
Type : Bearish
Timeframe : 1 hour
Bearish trend reversal : Moving Average 100
Type : Bearish
Timeframe : 1 hour
Bearish trend reversal : adaptative moving average 20
Type : Bearish
Timeframe : 1 hour
Bearish trend reversal : adaptative moving average 50
Type : Bearish
Timeframe : 1 hour
Bearish trend reversal : adaptative moving average 100
Type : Bearish
Timeframe : 1 hour
The technical indicators are generally neutral. They do not provide relevant information on the direction of future price movements.
Central Indicators, the scanner specialised in technical indicators, has identified these signals:
RSI indicator is back under 50
Type : Bearish
Timeframe : 1 hour
Parabolic SAR indicator bearish reversal
Type : Bearish
Timeframe : 1 hour
Price is back over the pivot point
Type : Bullish
Timeframe : Weekly
Williams %R indicator is back under -50
Type : Bearish
Timeframe : 1 hour
No signals are given by Central Patterns, a market scanner specialised in chart patterns, resistances and supports.
There is also a Japanese candlestick pattern detected by Central Candlesticks that could mark the end of the current short-term trend:
Doji
Type : Neutral
Timeframe : 1 hour
| S3 | S2 | S1 | Price | R1 | R2 | R3 | |
|---|---|---|---|---|---|---|---|
| ProTrendLines | 352.40 | 353.50 | 354.19 | 354.42 | 354.95 | 355.87 | 356.44 |
| Change (%) | -0.57% | -0.26% | -0.06% | - | +0.15% | +0.41% | +0.57% |
| Change | -2.02 | -0.92 | -0.23 | - | +0.53 | +1.45 | +2.02 |
| Level | Minor | Minor | Major | - | Minor | Intermediate | Intermediate |
Attention could also be paid to pivot points to set price objectives:
| Pivot points | S3 | S2 | S1 | PP | R1 | R2 | R3 |
|---|---|---|---|---|---|---|---|
| Standard | 351.07 | 352.53 | 353.40 | 354.86 | 355.73 | 357.19 | 358.06 |
| Camarilla | 353.64 | 353.85 | 354.07 | 354.28 | 354.49 | 354.71 | 354.92 |
| Woodie | 350.79 | 352.38 | 353.12 | 354.71 | 355.45 | 357.04 | 357.78 |
| Fibonacci | 352.53 | 353.42 | 353.97 | 354.86 | 355.75 | 356.30 | 357.19 |
| Pivot points | S3 | S2 | S1 | PP | R1 | R2 | R3 |
|---|---|---|---|---|---|---|---|
| Standard | 345.07 | 348.34 | 350.27 | 353.54 | 355.47 | 358.74 | 360.67 |
| Camarilla | 350.76 | 351.24 | 351.71 | 352.19 | 352.67 | 353.14 | 353.62 |
| Woodie | 344.39 | 348.01 | 349.59 | 353.21 | 354.79 | 358.41 | 359.99 |
| Fibonacci | 348.34 | 350.33 | 351.56 | 353.54 | 355.53 | 356.76 | 358.74 |
| Pivot points | S3 | S2 | S1 | PP | R1 | R2 | R3 |
|---|---|---|---|---|---|---|---|
| Standard | 331.96 | 341.58 | 348.66 | 358.28 | 365.36 | 374.98 | 382.06 |
| Camarilla | 351.15 | 352.68 | 354.21 | 355.74 | 357.27 | 358.80 | 360.33 |
| Woodie | 330.69 | 340.95 | 347.39 | 357.65 | 364.09 | 374.35 | 380.79 |
| Fibonacci | 341.58 | 347.96 | 351.90 | 358.28 | 364.66 | 368.60 | 374.98 |
Numerical data
The following is the status of the technical indicators and moving averages at the time of publication of this technical analysis:
| RSI (14): | 49.76 | |
| MACD (12,26,9): | 0.2500 | |
| Directional Movement: | 11.82 | |
| AROON (14): | 50.00 | |
| DEMA (21): | 355.41 | |
| Parabolic SAR (0,02-0,02-0,2): | 354.60 | |
| Elder Ray (13): | 0.16 | |
| Super Trend (3,10): | 354.53 | |
| Zig ZAG (10): | 354.84 | |
| VORTEX (21): | 1.0600 | |
| Stochastique (14,3,5): | 40.36 | |
| TEMA (21): | 355.45 | |
| Williams %R (14): | -75.10 | |
| Chande Momentum Oscillator (20): | 0.24 | |
| Repulse (5,40,3): | -0.3900 | |
| ROCnROLL: | -1 | |
| TRIX (15,9): | 0.0100 | |
| Courbe Coppock: | 0.53 |
| MA7: | 353.92 | |
| MA20: | 355.50 | |
| MA50: | 357.66 | |
| MA100: | 359.98 | |
| MAexp7: | 355.28 | |
| MAexp20: | 355.11 | |
| MAexp50: | 354.74 | |
| MAexp100: | 354.45 | |
| Price / MA7: | +0.14% | |
| Price / MA20: | -0.30% | |
| Price / MA50: | -0.91% | |
| Price / MA100: | -1.54% | |
| Price / MAexp7: | -0.24% | |
| Price / MAexp20: | -0.19% | |
| Price / MAexp50: | -0.09% | |
| Price / MAexp100: | -0.01% |
News
The last news published on USD/HUF at the time of the generation of this analysis was as follows:
About author

Online


Add a comment
Comments
0 comments on the analysis USD/HUF - 1H