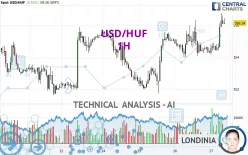
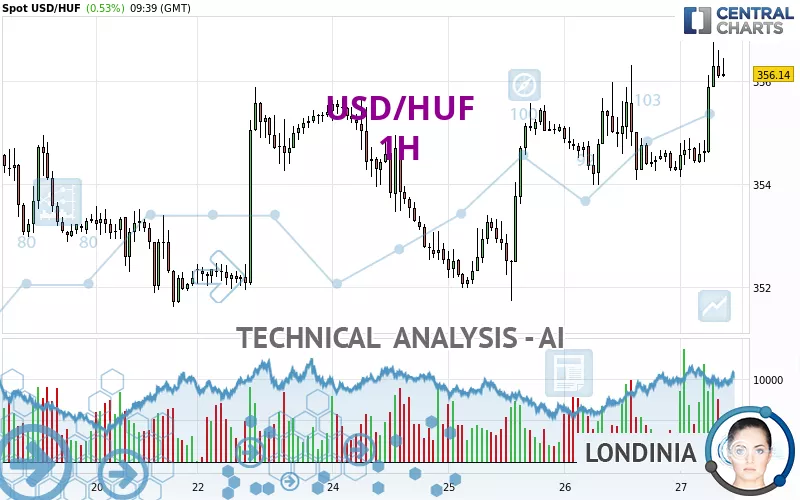
USD/HUF - 1H - Technical analysis published on 09/27/2024 (GMT)
- 100
- 0
Click here for a new analysis!
- Timeframe : 1H
- - Analysis generated on
- Status : INVALID
Summary of the analysis

Additional analysis
Quotes
USD/HUF rating 356.13 HUF. The price has increased by +0.52% since the last closing and was between 354.14 HUF and 356.75 HUF. This implies that the price is at +0.56% from its lowest and at -0.17% from its highest.Here is a more detailed summary of the historical variations registered by USD/HUF:
Near a new HIGH record (1 year)
Type : Bullish
Timeframe : Weekly
Near a new HIGH record (1st january)
Type : Bullish
Timeframe : Weekly
Near a new HIGH record (1 month)
Type : Bullish
Timeframe : Weekly
Technical
Technical analysis of USD/HUF in 1H shows a strongly overall bullish trend. 92.86% of the signals given by moving averages are bullish. The overall trend is supported by the strong bullish signals from short-term moving averages. The Central Indicators scanner does not detect any result on moving averages that would impact this trend.
In fact, 15 technical indicators on 18 studied are currently bullish. Central Indicators, the detector scanner for these technical indicators has recently detected several signals:
Pivot points : price is over resistance 1
Type : Neutral
Timeframe : 1 hour
Pivot points : price is over resistance 1
Type : Neutral
Timeframe : Weekly
No signals are given by Central Patterns, a market scanner specialised in chart patterns, resistances and supports.
The Central Candlesticks scanner currently notes the presence of this pattern in Japanese candlesticks that could mark the end of the short-term trend currently underway:
Doji
Type : Neutral
Timeframe : 1 hour
| S3 | S2 | S1 | Price | R1 | R2 | R3 | |
|---|---|---|---|---|---|---|---|
| ProTrendLines | 354.19 | 354.95 | 355.87 | 356.13 | 356.44 | 360.20 | 367.95 |
| Change (%) | -0.54% | -0.33% | -0.07% | - | +0.09% | +1.14% | +3.32% |
| Change | -1.94 | -1.18 | -0.26 | - | +0.31 | +4.07 | +11.82 |
| Level | Major | Minor | Intermediate | - | Intermediate | Intermediate | Minor |
Pivot points can also be used to set your price objectives. Here is the price situation in relation to pivot points:
| Pivot points | S3 | S2 | S1 | PP | R1 | R2 | R3 |
|---|---|---|---|---|---|---|---|
| Standard | 351.07 | 352.53 | 353.40 | 354.86 | 355.73 | 357.19 | 358.06 |
| Camarilla | 353.64 | 353.85 | 354.07 | 354.28 | 354.49 | 354.71 | 354.92 |
| Woodie | 350.79 | 352.38 | 353.12 | 354.71 | 355.45 | 357.04 | 357.78 |
| Fibonacci | 352.53 | 353.42 | 353.97 | 354.86 | 355.75 | 356.30 | 357.19 |
| Pivot points | S3 | S2 | S1 | PP | R1 | R2 | R3 |
|---|---|---|---|---|---|---|---|
| Standard | 345.07 | 348.34 | 350.27 | 353.54 | 355.47 | 358.74 | 360.67 |
| Camarilla | 350.76 | 351.24 | 351.71 | 352.19 | 352.67 | 353.14 | 353.62 |
| Woodie | 344.39 | 348.01 | 349.59 | 353.21 | 354.79 | 358.41 | 359.99 |
| Fibonacci | 348.34 | 350.33 | 351.56 | 353.54 | 355.53 | 356.76 | 358.74 |
| Pivot points | S3 | S2 | S1 | PP | R1 | R2 | R3 |
|---|---|---|---|---|---|---|---|
| Standard | 331.96 | 341.58 | 348.66 | 358.28 | 365.36 | 374.98 | 382.06 |
| Camarilla | 351.15 | 352.68 | 354.21 | 355.74 | 357.27 | 358.80 | 360.33 |
| Woodie | 330.69 | 340.95 | 347.39 | 357.65 | 364.09 | 374.35 | 380.79 |
| Fibonacci | 341.58 | 347.96 | 351.90 | 358.28 | 364.66 | 368.60 | 374.98 |
Numerical data
The following is the status of the technical indicators and moving averages at the time of publication of this technical analysis:
| RSI (14): | 67.97 | |
| MACD (12,26,9): | 0.3500 | |
| Directional Movement: | 25.68 | |
| AROON (14): | 50.00 | |
| DEMA (21): | 355.49 | |
| Parabolic SAR (0,02-0,02-0,2): | 354.32 | |
| Elder Ray (13): | 0.87 | |
| Super Trend (3,10): | 354.53 | |
| Zig ZAG (10): | 356.26 | |
| VORTEX (21): | 1.1200 | |
| Stochastique (14,3,5): | 79.95 | |
| TEMA (21): | 355.73 | |
| Williams %R (14): | -14.18 | |
| Chande Momentum Oscillator (20): | 1.79 | |
| Repulse (5,40,3): | 0.1900 | |
| ROCnROLL: | 1 | |
| TRIX (15,9): | 0.0100 | |
| Courbe Coppock: | 0.55 |
| MA7: | 354.15 | |
| MA20: | 355.56 | |
| MA50: | 357.68 | |
| MA100: | 359.99 | |
| MAexp7: | 355.65 | |
| MAexp20: | 355.10 | |
| MAexp50: | 354.68 | |
| MAexp100: | 354.41 | |
| Price / MA7: | +0.56% | |
| Price / MA20: | +0.16% | |
| Price / MA50: | -0.43% | |
| Price / MA100: | -1.07% | |
| Price / MAexp7: | +0.13% | |
| Price / MAexp20: | +0.29% | |
| Price / MAexp50: | +0.41% | |
| Price / MAexp100: | +0.49% |
News
Don't forget to follow the news on USD/HUF. At the time of publication of this analysis, the latest news was as follows:
About author

Online


Add a comment
Comments
0 comments on the analysis USD/HUF - 1H