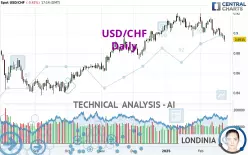
USD/CHF - Daily - Technical analysis published on 02/25/2025 (GMT)
- 94
- 0
Click here for a new analysis!
- Timeframe : Daily
- - Analysis generated on
- Status : INVALID

Summary of the analysis

Additional analysis
Quotes
The USD/CHF rating is 0.8936 CHF. On the day, this instrument lost -0.42% with the lowest point at 0.8912 CHF and the highest point at 0.8978 CHF. The deviation from the price is +0.27% for the low point and -0.47% for the high point.So that you have an overall view of the price change, here is a table showing the variations over several periods:
Near a new HIGH record (1 year)
Type : Bullish
Timeframe : Weekly
Near a new HIGH record (1st january)
Type : Bullish
Timeframe : Weekly
New LOW record (1st january)
Type : Bearish
Timeframe : Weekly
Near a new HIGH record (1 month)
Type : Bullish
Timeframe : Weekly
New LOW record (1 month)
Type : Bearish
Timeframe : Weekly
Technical
Technical analysis of this Daily chart of USD/CHF indicates that the overall trend is slightly bearish. 60.71% of the signals given by moving averages are bearish. The overall trend could accelerate as a result of the strong bearish signals from short-term moving averages. The Central Indicators market scanner is currently detecting several bearish signals that could impact this trend:
Moving Average bearish crossovers : MA20 & MA50
Type : Bearish
Timeframe : Daily
Bearish price crossover with adaptative moving average 100
Type : Bearish
Timeframe : Daily
In fact, according to the parameters integrated into the Central Analyzer system, 12 technical indicators out of 18 analysed are currently bearish. Caution: the Central Indicators scanner currently detects an excess:
CCI indicator is oversold : under -100
Type : Neutral
Timeframe : Daily
Williams %R indicator is oversold : under -80
Type : Neutral
Timeframe : Daily
Pivot points : price is under support 1
Type : Neutral
Timeframe : Weekly
Pivot points : price is under support 3
Type : Neutral
Timeframe : Daily
An analysis of the price chart with the Central Patterns scanner (detector of chart patterns and resistances and supports) shows several results that can have an impact on the price change:
Near horizontal support
Type : Bullish
Timeframe : Daily
Support of channel is broken
Type : Bearish
Timeframe : Daily
No result was found by the Central Candlesticks scanner on Japanese candlesticks.
| S3 | S2 | S1 | Price | R1 | R2 | R3 | |
|---|---|---|---|---|---|---|---|
| ProTrendLines | 0.8412 | 0.8547 | 0.8836 | 0.8936 | 0.8997 | 0.9214 | 0.9418 |
| Change (%) | -5.86% | -4.35% | -1.12% | - | +0.68% | +3.11% | +5.39% |
| Change | -0.0524 | -0.0389 | -0.0100 | - | +0.0061 | +0.0278 | +0.0482 |
| Level | Major | Major | Intermediate | - | Major | Major | Minor |
Pivot points can also be used to set your price objectives. Here is the price situation in relation to pivot points:
| Pivot points | S3 | S2 | S1 | PP | R1 | R2 | R3 |
|---|---|---|---|---|---|---|---|
| Standard | 0.8907 | 0.8930 | 0.8952 | 0.8975 | 0.8997 | 0.9020 | 0.9042 |
| Camarilla | 0.8962 | 0.8966 | 0.8970 | 0.8974 | 0.8978 | 0.8982 | 0.8986 |
| Woodie | 0.8907 | 0.8930 | 0.8952 | 0.8975 | 0.8997 | 0.9020 | 0.9042 |
| Fibonacci | 0.8930 | 0.8947 | 0.8958 | 0.8975 | 0.8992 | 0.9003 | 0.9020 |
| Pivot points | S3 | S2 | S1 | PP | R1 | R2 | R3 |
|---|---|---|---|---|---|---|---|
| Standard | 0.8865 | 0.8916 | 0.8952 | 0.9003 | 0.9039 | 0.9090 | 0.9126 |
| Camarilla | 0.8963 | 0.8971 | 0.8979 | 0.8987 | 0.8995 | 0.9003 | 0.9011 |
| Woodie | 0.8857 | 0.8912 | 0.8944 | 0.8999 | 0.9031 | 0.9086 | 0.9118 |
| Fibonacci | 0.8916 | 0.8950 | 0.8970 | 0.9003 | 0.9037 | 0.9057 | 0.9090 |
| Pivot points | S3 | S2 | S1 | PP | R1 | R2 | R3 |
|---|---|---|---|---|---|---|---|
| Standard | 0.8748 | 0.8857 | 0.8984 | 0.9093 | 0.9220 | 0.9329 | 0.9456 |
| Camarilla | 0.9047 | 0.9069 | 0.9090 | 0.9112 | 0.9134 | 0.9155 | 0.9177 |
| Woodie | 0.8758 | 0.8862 | 0.8994 | 0.9098 | 0.9230 | 0.9334 | 0.9466 |
| Fibonacci | 0.8857 | 0.8947 | 0.9003 | 0.9093 | 0.9183 | 0.9239 | 0.9329 |
Numerical data
The following is the status of technical indicators and moving averages registered at the time this technical analysis was created:
| RSI (14): | 35.51 | |
| MACD (12,26,9): | -0.0024 | |
| Directional Movement: | -13.7662 | |
| AROON (14): | -64.2857 | |
| DEMA (21): | 0.9008 | |
| Parabolic SAR (0,02-0,02-0,2): | 0.9126 | |
| Elder Ray (13): | -0.0069 | |
| Super Trend (3,10): | 0.9115 | |
| Zig ZAG (10): | 0.8924 | |
| VORTEX (21): | 0.9561 | |
| Stochastique (14,3,5): | 8.46 | |
| TEMA (21): | 0.8967 | |
| Williams %R (14): | -95.08 | |
| Chande Momentum Oscillator (20): | -0.0177 | |
| Repulse (5,40,3): | -0.9307 | |
| ROCnROLL: | 2 | |
| TRIX (15,9): | -0.0125 | |
| Courbe Coppock: | 1.85 |
| MA7: | 0.8994 | |
| MA20: | 0.9049 | |
| MA50: | 0.9055 | |
| MA100: | 0.8901 | |
| MAexp7: | 0.8987 | |
| MAexp20: | 0.9029 | |
| MAexp50: | 0.9012 | |
| MAexp100: | 0.8940 | |
| Price / MA7: | -0.64% | |
| Price / MA20: | -1.25% | |
| Price / MA50: | -1.31% | |
| Price / MA100: | +0.39% | |
| Price / MAexp7: | -0.57% | |
| Price / MAexp20: | -1.03% | |
| Price / MAexp50: | -0.84% | |
| Price / MAexp100: | -0.04% |
News
Don't forget to follow the news on USD/CHF. At the time of publication of this analysis, the latest news was as follows:
-
 USD/CHF Analysis: Can the USD Turn Things Around?
-
USD/CHF Analysis: Franc Comes Roaring Back
-
USD/CHF Analysis: Is Inertia Building Here?
-
USD/CHF Analysis: Can the Dollar Finally Break Out Against the Swissy?
-
USD/CHF Price Analysis: Can the USD Break the Franc?
About author

Online


Add a comment
Comments
0 comments on the analysis USD/CHF - Daily