USD/CHF - Daily - Technical analysis published on 02/24/2025 (GMT)
- 95
- 0
- Timeframe : Daily
- - Analysis generated on
- Status : IN PROGRESS...

Summary of the analysis

Additional analysis
Quotes
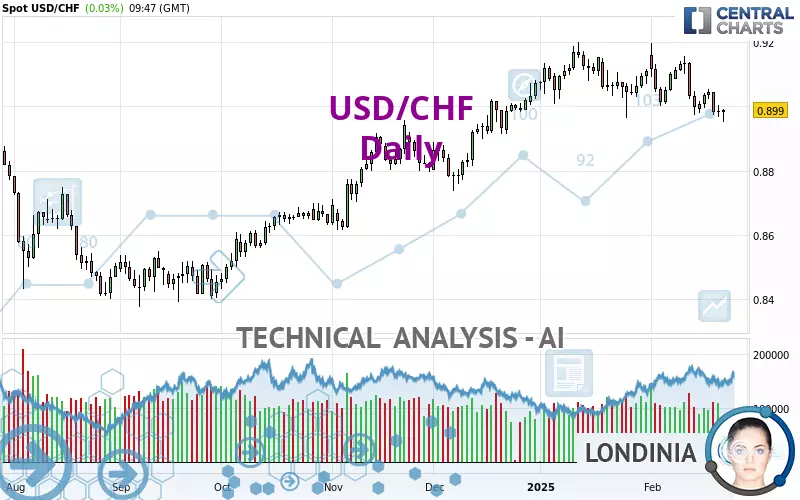
The USD/CHF rating is 0.8990 CHF. The price has increased by +0.03% since the last closing and was between 0.8953 CHF and 0.8991 CHF. This implies that the price is at +0.41% from its lowest and at -0.01% from its highest.A bearish opening was detected by the Central Gaps scanner. Sellers are trying to impose a bearish trend in the very short term.
Bearish opening
Type : Bearish
Timeframe : Openning
So that you have an overall view of the price change, here is a table showing the variations over several periods:
Near a new HIGH record (1 year)
Type : Bullish
Timeframe : Weekly
Near a new HIGH record (1st january)
Type : Bullish
Timeframe : Weekly
New LOW record (1st january)
Type : Bearish
Timeframe : Weekly
Near a new HIGH record (1 month)
Type : Bullish
Timeframe : Weekly
New LOW record (1 month)
Type : Bearish
Timeframe : Weekly
Technical
Technical analysis of USD/CHF in Daily shows an overall slightly bullish trend. 57.14% of the signals given by moving averages are bullish. Caution: the strong bearish signals currently given by short-term moving averages indicate that a trend reversal may be taking place. The Central Indicators scanner does not detect any result on moving averages that would impact this trend.
An assessment of technical indicators does not currently provide any relevant information on the direction of future price movements.
Caution: the Central Indicators scanner currently detects an excess:
CCI indicator is oversold : under -100
Type : Neutral
Timeframe : Daily
Williams %R indicator is oversold : under -80
Type : Neutral
Timeframe : Daily
Price is back over the pivot point
Type : Bullish
Timeframe : Daily
The Central Patterns scanner, which studies chart patterns, resistances and supports, has identified these signals:
Near horizontal support
Type : Bullish
Timeframe : Daily
Support of channel is broken
Type : Bearish
Timeframe : Daily
Support of triangle is broken
Type : Bearish
Timeframe : Daily
The Central Candlesticks scanner, specialised in Japanese candlesticks, did not identify any signals.
| S3 | S2 | S1 | Price | R1 | R2 | R3 | |
|---|---|---|---|---|---|---|---|
| ProTrendLines | 0.8412 | 0.8547 | 0.8836 | 0.8990 | 0.8997 | 0.9214 | 0.9418 |
| Change (%) | -6.43% | -4.93% | -1.71% | - | +0.08% | +2.49% | +4.76% |
| Change | -0.0578 | -0.0443 | -0.0154 | - | +0.0007 | +0.0224 | +0.0428 |
| Level | Major | Major | Intermediate | - | Major | Major | Minor |
Attention could also be paid to pivot points to set price objectives:
| Pivot points | S3 | S2 | S1 | PP | R1 | R2 | R3 |
|---|---|---|---|---|---|---|---|
| Standard | 0.8931 | 0.8950 | 0.8968 | 0.8987 | 0.9005 | 0.9024 | 0.9042 |
| Camarilla | 0.8977 | 0.8980 | 0.8984 | 0.8987 | 0.8990 | 0.8994 | 0.8997 |
| Woodie | 0.8932 | 0.8950 | 0.8969 | 0.8987 | 0.9006 | 0.9024 | 0.9043 |
| Fibonacci | 0.8950 | 0.8964 | 0.8973 | 0.8987 | 0.9001 | 0.9010 | 0.9024 |
| Pivot points | S3 | S2 | S1 | PP | R1 | R2 | R3 |
|---|---|---|---|---|---|---|---|
| Standard | 0.8865 | 0.8916 | 0.8952 | 0.9003 | 0.9039 | 0.9090 | 0.9126 |
| Camarilla | 0.8963 | 0.8971 | 0.8979 | 0.8987 | 0.8995 | 0.9003 | 0.9011 |
| Woodie | 0.8857 | 0.8912 | 0.8944 | 0.8999 | 0.9031 | 0.9086 | 0.9118 |
| Fibonacci | 0.8916 | 0.8950 | 0.8970 | 0.9003 | 0.9037 | 0.9057 | 0.9090 |
| Pivot points | S3 | S2 | S1 | PP | R1 | R2 | R3 |
|---|---|---|---|---|---|---|---|
| Standard | 0.8748 | 0.8857 | 0.8984 | 0.9093 | 0.9220 | 0.9329 | 0.9456 |
| Camarilla | 0.9047 | 0.9069 | 0.9090 | 0.9112 | 0.9134 | 0.9155 | 0.9177 |
| Woodie | 0.8758 | 0.8862 | 0.8994 | 0.9098 | 0.9230 | 0.9334 | 0.9466 |
| Fibonacci | 0.8857 | 0.8947 | 0.9003 | 0.9093 | 0.9183 | 0.9239 | 0.9329 |
Numerical data
The following are the details of the technical indicators and moving averages that were collected to generate this technical analysis:
| RSI (14): | 42.16 | |
| MACD (12,26,9): | -0.0015 | |
| Directional Movement: | -9.5635 | |
| AROON (14): | -57.1429 | |
| DEMA (21): | 0.9030 | |
| Parabolic SAR (0,02-0,02-0,2): | 0.9142 | |
| Elder Ray (13): | -0.0060 | |
| Super Trend (3,10): | 0.9136 | |
| Zig ZAG (10): | 0.8989 | |
| VORTEX (21): | 0.9404 | |
| Stochastique (14,3,5): | 10.76 | |
| TEMA (21): | 0.8995 | |
| Williams %R (14): | -81.77 | |
| Chande Momentum Oscillator (20): | -0.0062 | |
| Repulse (5,40,3): | 0.0503 | |
| ROCnROLL: | 2 | |
| TRIX (15,9): | -0.0058 | |
| Courbe Coppock: | 1.37 |
| MA7: | 0.9007 | |
| MA20: | 0.9056 | |
| MA50: | 0.9055 | |
| MA100: | 0.8898 | |
| MAexp7: | 0.9012 | |
| MAexp20: | 0.9042 | |
| MAexp50: | 0.9016 | |
| MAexp100: | 0.8941 | |
| Price / MA7: | -0.19% | |
| Price / MA20: | -0.73% | |
| Price / MA50: | -0.72% | |
| Price / MA100: | +1.03% | |
| Price / MAexp7: | -0.24% | |
| Price / MAexp20: | -0.58% | |
| Price / MAexp50: | -0.29% | |
| Price / MAexp100: | +0.55% |
News
The last news published on USD/CHF at the time of the generation of this analysis was as follows:
-
 USD/CHF Analysis: Can the USD Turn Things Around?
-
USD/CHF Analysis: Franc Comes Roaring Back
-
USD/CHF Analysis: Is Inertia Building Here?
-
USD/CHF Analysis: Can the Dollar Finally Break Out Against the Swissy?
-
USD/CHF Price Analysis: Can the USD Break the Franc?
About author

Online


Add a comment
Comments
0 comments on the analysis USD/CHF - Daily