USD/CAD - 1H - Technical analysis published on 01/13/2025 (GMT)
- 121
- 0
Click here for a new analysis!
- Timeframe : 1H
- - Analysis generated on
- Status : TARGET REACHED
Summary of the analysis

Additional analysis
Quotes
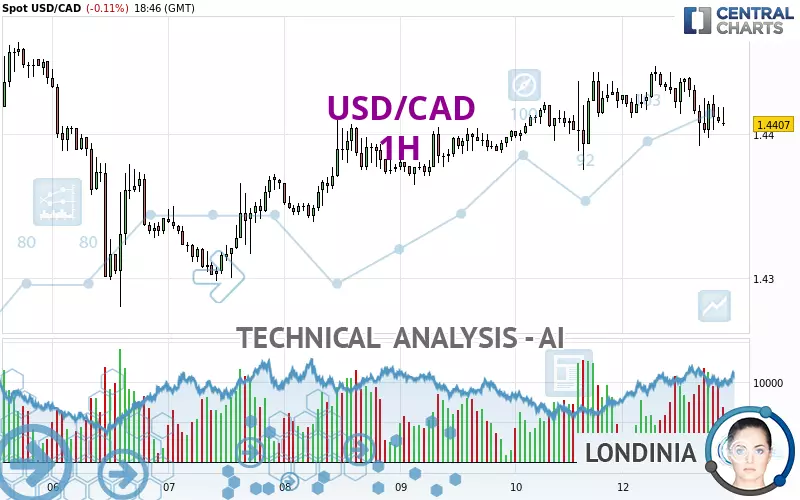
The USD/CAD price is 1.4406 CAD. On the day, this instrument lost -0.12% and was between 1.4392 CAD and 1.4447 CAD. This implies that the price is at +0.10% from its lowest and at -0.28% from its highest.A bullish opening was detected by the Central Gaps scanner. Buyers are trying to impose a bullish momentum in the very short term.
Bullish opening
Type : Bullish
Timeframe : Openning
Here is a more detailed summary of the historical variations registered by USD/CAD:
Near a new HIGH record (5 years)
Type : Bullish
Timeframe : Weekly
Near a new HIGH record (1 year)
Type : Bullish
Timeframe : Weekly
Near a new LOW record (1st january)
Type : Bearish
Timeframe : Weekly
Near a new LOW record (1 month)
Type : Bearish
Timeframe : Weekly
Technical
Technical analysis of USD/CAD in 1H shows an overall slightly bullish trend. 57.14% of the signals given by moving averages are bullish. Caution: the strong bearish signals currently being given by short-term moving averages indicate that this slightly bullish trend could be reversed. The Central Indicators scanner does not detect any result on moving averages that would impact this trend.
In fact, according to the parameters integrated into the Central Analyzer system, only 7 technical indicators out of 18 analysed are currently bearish. The Central Indicators scanner found no further results concerning independent technical indicators.
Central Patterns, the market scanner focusing on chart patterns, resistances and supports found this result:
Near support of triangle
Type : Bullish
Timeframe : 1 hour
The Central Candlesticks scanner currently notes the presence of this pattern in Japanese candlesticks that could mark the end of the short-term trend currently underway:
Doji
Type : Neutral
Timeframe : 1 hour
| S3 | S2 | S1 | Price | R1 | R2 | R3 | |
|---|---|---|---|---|---|---|---|
| ProTrendLines | 1.4280 | 1.4347 | 1.4374 | 1.4406 | 1.4410 | 1.4443 | 1.4464 |
| Change (%) | -0.87% | -0.41% | -0.22% | - | +0.03% | +0.26% | +0.40% |
| Change | -0.0126 | -0.0059 | -0.0032 | - | +0.0004 | +0.0037 | +0.0058 |
| Level | Minor | Intermediate | Intermediate | - | Intermediate | Intermediate | Minor |
Attention could also be paid to pivot points to set price objectives:
| Pivot points | S3 | S2 | S1 | PP | R1 | R2 | R3 |
|---|---|---|---|---|---|---|---|
| Standard | 1.4316 | 1.4346 | 1.4384 | 1.4414 | 1.4452 | 1.4482 | 1.4520 |
| Camarilla | 1.4404 | 1.4411 | 1.4417 | 1.4423 | 1.4429 | 1.4436 | 1.4442 |
| Woodie | 1.4321 | 1.4348 | 1.4389 | 1.4416 | 1.4457 | 1.4484 | 1.4525 |
| Fibonacci | 1.4346 | 1.4372 | 1.4388 | 1.4414 | 1.4440 | 1.4456 | 1.4482 |
| Pivot points | S3 | S2 | S1 | PP | R1 | R2 | R3 |
|---|---|---|---|---|---|---|---|
| Standard | 1.4146 | 1.4213 | 1.4318 | 1.4385 | 1.4490 | 1.4557 | 1.4662 |
| Camarilla | 1.4376 | 1.4392 | 1.4407 | 1.4423 | 1.4439 | 1.4455 | 1.4470 |
| Woodie | 1.4165 | 1.4223 | 1.4337 | 1.4395 | 1.4509 | 1.4567 | 1.4681 |
| Fibonacci | 1.4213 | 1.4279 | 1.4319 | 1.4385 | 1.4451 | 1.4491 | 1.4557 |
| Pivot points | S3 | S2 | S1 | PP | R1 | R2 | R3 |
|---|---|---|---|---|---|---|---|
| Standard | 1.3608 | 1.3796 | 1.4090 | 1.4278 | 1.4572 | 1.4760 | 1.5054 |
| Camarilla | 1.4251 | 1.4295 | 1.4339 | 1.4383 | 1.4427 | 1.4471 | 1.4516 |
| Woodie | 1.3660 | 1.3823 | 1.4142 | 1.4305 | 1.4624 | 1.4787 | 1.5106 |
| Fibonacci | 1.3796 | 1.3981 | 1.4094 | 1.4278 | 1.4463 | 1.4576 | 1.4760 |
Numerical data
The following are the details of the technical indicators and moving averages that were collected to generate this technical analysis:
| RSI (14): | 45.10 | |
| MACD (12,26,9): | -0.0002 | |
| Directional Movement: | -6.7540 | |
| AROON (14): | -64.2857 | |
| DEMA (21): | 1.4419 | |
| Parabolic SAR (0,02-0,02-0,2): | 1.4442 | |
| Elder Ray (13): | -0.0004 | |
| Super Trend (3,10): | 1.4399 | |
| Zig ZAG (10): | 1.4409 | |
| VORTEX (21): | 0.9568 | |
| Stochastique (14,3,5): | 32.88 | |
| TEMA (21): | 1.4412 | |
| Williams %R (14): | -68.63 | |
| Chande Momentum Oscillator (20): | -0.0025 | |
| Repulse (5,40,3): | -0.0967 | |
| ROCnROLL: | 2 | |
| TRIX (15,9): | 0.0015 | |
| Courbe Coppock: | 0.24 |
| MA7: | 1.4395 | |
| MA20: | 1.4374 | |
| MA50: | 1.4161 | |
| MA100: | 1.3898 | |
| MAexp7: | 1.4413 | |
| MAexp20: | 1.4419 | |
| MAexp50: | 1.4413 | |
| MAexp100: | 1.4402 | |
| Price / MA7: | +0.08% | |
| Price / MA20: | +0.22% | |
| Price / MA50: | +1.73% | |
| Price / MA100: | +3.66% | |
| Price / MAexp7: | -0.05% | |
| Price / MAexp20: | -0.09% | |
| Price / MAexp50: | -0.05% | |
| Price / MAexp100: | +0.03% |
News
The latest news and videos published on USD/CAD at the time of the analysis were as follows:
-
 USD/CAD Price Analysis - Is the Dam About to Break?
-
USD/CAD Price Forecast - Is the Loonie Struggling Again? (January 8, 2025 Forecast)
-
USD/CAD Price Forecast - Wild Day in the Loonie, as US Wins the World Juniors in Canada
-
USD/CAD Price Forecast - Will the Barrier Continue to Hold?
-
USD/CAD Forecast Will the Dam Break for the Canadian Dollar?
About author

Online


Add a comment
Comments
0 comments on the analysis USD/CAD - 1H