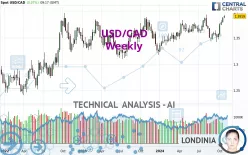
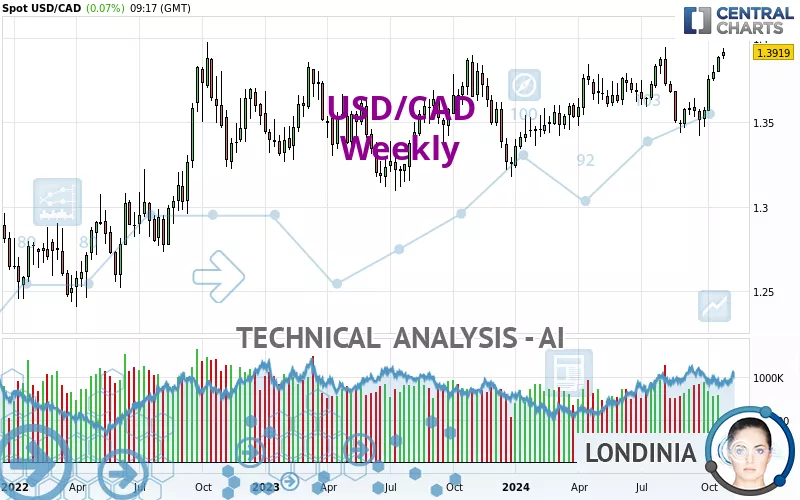
USD/CAD - Weekly - Technical analysis published on 10/31/2024 (GMT)
- 303
- 0
Click here for a new analysis!
- Timeframe : Weekly
- - Analysis generated on
- Status : TARGET REACHED
Summary of the analysis

Additional analysis
Quotes
USD/CAD rating 1.3919 CAD. Over 5 days, this instrument gained +0.47% with the lowest point at 1.3876 CAD and the highest point at 1.3941 CAD. The deviation from the price is +0.31% for the low point and -0.16% for the high point.Here is a more detailed summary of the historical variations registered by USD/CAD:
Near a new HIGH record (1 year)
Type : Bullish
Timeframe : Weekly
Near a new LOW record (1st january)
Type : Bearish
Timeframe : Weekly
Near a new LOW record (1 month)
Type : Bearish
Timeframe : Weekly
Technical
Technical analysis of USD/CAD in Weekly shows a strongly overall bullish trend. 92.86% of the signals given by moving averages are bullish. This strongly bullish trend is supported by the strong bullish signals given by short-term moving averages. There is no crossing of moving average by the price or crossing of moving averages between themselves.
The probability of a further increase is high given the direction of the technical indicators.
Caution: the Central Indicators scanner currently detects an excess:
CCI indicator is overbought : over 100
Type : Neutral
Timeframe : Weekly
Williams %R indicator is overbought : over -20
Type : Neutral
Timeframe : Weekly
An analysis of the price chart with the Central Patterns scanner (detector of chart patterns and resistances and supports) shows a result that can have an impact on the price change:
Near resistance of channel
Type : Bearish
Timeframe : Weekly
No result was found by the Central Candlesticks scanner on Japanese candlesticks.
| S3 | S2 | S1 | Price | R1 | |
|---|---|---|---|---|---|
| ProTrendLines | 1.2482 | 1.2981 | 1.3873 | 1.3919 | 1.4534 |
| Change (%) | -10.32% | -6.74% | -0.33% | - | +4.42% |
| Change | -0.1437 | -0.0938 | -0.0046 | - | +0.0615 |
| Level | Minor | Major | Major | - | Intermediate |
Attention could also be paid to pivot points to set price objectives:
| Pivot points | S3 | S2 | S1 | PP | R1 | R2 | R3 |
|---|---|---|---|---|---|---|---|
| Standard | 1.3843 | 1.3869 | 1.3889 | 1.3915 | 1.3935 | 1.3961 | 1.3981 |
| Camarilla | 1.3896 | 1.3901 | 1.3905 | 1.3909 | 1.3913 | 1.3917 | 1.3922 |
| Woodie | 1.3840 | 1.3868 | 1.3886 | 1.3914 | 1.3932 | 1.3960 | 1.3978 |
| Fibonacci | 1.3869 | 1.3887 | 1.3897 | 1.3915 | 1.3933 | 1.3943 | 1.3961 |
| Pivot points | S3 | S2 | S1 | PP | R1 | R2 | R3 |
|---|---|---|---|---|---|---|---|
| Standard | 1.3725 | 1.3761 | 1.3825 | 1.3861 | 1.3925 | 1.3961 | 1.4025 |
| Camarilla | 1.3862 | 1.3871 | 1.3880 | 1.3889 | 1.3898 | 1.3907 | 1.3917 |
| Woodie | 1.3739 | 1.3768 | 1.3839 | 1.3868 | 1.3939 | 1.3968 | 1.4039 |
| Fibonacci | 1.3761 | 1.3799 | 1.3823 | 1.3861 | 1.3899 | 1.3923 | 1.3961 |
| Pivot points | S3 | S2 | S1 | PP | R1 | R2 | R3 |
|---|---|---|---|---|---|---|---|
| Standard | 1.3185 | 1.3302 | 1.3414 | 1.3531 | 1.3643 | 1.3760 | 1.3872 |
| Camarilla | 1.3463 | 1.3484 | 1.3505 | 1.3526 | 1.3547 | 1.3568 | 1.3589 |
| Woodie | 1.3183 | 1.3301 | 1.3412 | 1.3530 | 1.3641 | 1.3759 | 1.3870 |
| Fibonacci | 1.3302 | 1.3390 | 1.3444 | 1.3531 | 1.3619 | 1.3673 | 1.3760 |
Numerical data
The following is the status of the technical indicators and moving averages at the time of publication of this technical analysis:
| RSI (14): | 64.31 | |
| MACD (12,26,9): | 0.0046 | |
| Directional Movement: | 14.2763 | |
| AROON (14): | -50.0000 | |
| DEMA (21): | 1.3745 | |
| Parabolic SAR (0,02-0,02-0,2): | 1.3446 | |
| Elder Ray (13): | 0.0190 | |
| Super Trend (3,10): | 1.3544 | |
| Zig ZAG (10): | 1.3918 | |
| VORTEX (21): | 1.1081 | |
| Stochastique (14,3,5): | 85.04 | |
| TEMA (21): | 1.3766 | |
| Williams %R (14): | -5.49 | |
| Chande Momentum Oscillator (20): | 0.0188 | |
| Repulse (5,40,3): | 1.4821 | |
| ROCnROLL: | 1 | |
| TRIX (15,9): | 0.0173 | |
| Courbe Coppock: | 0.19 |
| MA7: | 1.3887 | |
| MA20: | 1.3793 | |
| MA50: | 1.3634 | |
| MA100: | 1.3674 | |
| MAexp7: | 1.3771 | |
| MAexp20: | 1.3694 | |
| MAexp50: | 1.3627 | |
| MAexp100: | 1.3522 | |
| Price / MA7: | +0.23% | |
| Price / MA20: | +0.91% | |
| Price / MA50: | +2.09% | |
| Price / MA100: | +1.79% | |
| Price / MAexp7: | +1.07% | |
| Price / MAexp20: | +1.64% | |
| Price / MAexp50: | +2.14% | |
| Price / MAexp100: | +2.94% |
News
The latest news and videos published on USD/CAD at the time of the analysis were as follows:
-
 USD/CAD Forecast October 17, 2024
-
USD/CAD Forecast October 4, 2024
-
USD/CAD Forecast October 2, 2024
-
USD/CAD Forecast September 27, 2024
-
USD/CAD Forecast September 25, 2024
About author

Online


Add a comment
Comments
0 comments on the analysis USD/CAD - Weekly