| Open: | - |
| Change: | - |
| Volume: | - |
| Low: | - |
| High: | - |
| High / Low range: | - |
| Type: | Forex |
| Ticker: | USDCAD |
| ISIN: |
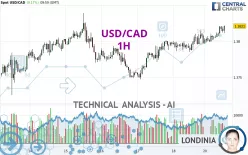
USD/CAD - 1H - Technical analysis published on 10/21/2024 (GMT)
- 108
- 0
- 10/21/2024 - 09:59
Click here for a new analysis!
- Timeframe : 1H
- - Analysis generated on 10/21/2024 - 09:59
- Status : TARGET REACHED

Summary of the analysis

Additional analysis
Quotes
USD/CAD rating 1.3821 CAD. The price has increased by +0.17% since the last closing and was traded between 1.3797 CAD and 1.3822 CAD over the period. The price is currently at +0.17% from its lowest and -0.01% from its highest.A study of price movements over other periods shows the following variations:
Near a new LOW record (1 year)
Type : Bearish
Timeframe : Weekly
Near a new LOW record (1st january)
Type : Bearish
Timeframe : Weekly
Near a new LOW record (1 month)
Type : Bearish
Timeframe : Weekly
Technical
Technical analysis of this 1H chart of USD/CAD indicates that the overall trend is strongly bullish. 92.86% of the signals given by moving averages are bullish. This strongly bullish trend is supported by the strong bullish signals given by short-term moving averages. The Central Indicators market scanner currently does not detect any result that concerns moving averages.
The probability of a further increase is high given the direction of the technical indicators.
Caution: the Central Indicators scanner currently detects an excess:
CCI indicator is overbought : over 100
Type : Neutral
Timeframe : 1 hour
Pivot points : price is over resistance 1
Type : Neutral
Timeframe : 1 hour
The Central Patterns scanner, which studies chart patterns, resistances and supports, has identified this signal:
Near support of channel
Type : Bullish
Timeframe : 1 hour
There is also a Japanese candlestick pattern detected by Central Candlesticks that could mark the end of the current short-term trend:
White hanging man / hammer
Type : Neutral
Timeframe : 1 hour
| S3 | S2 | S1 | Price | R1 | R2 | R3 | |
|---|---|---|---|---|---|---|---|
| ProTrendLines | 1.3785 | 1.3801 | 1.3819 | 1.3821 | 1.3839 | 1.3873 | 1.4534 |
| Change (%) | -0.26% | -0.14% | -0.01% | - | +0.13% | +0.38% | +5.16% |
| Change | -0.0036 | -0.0020 | -0.0002 | - | +0.0018 | +0.0052 | +0.0713 |
| Level | Major | Intermediate | Minor | - | Minor | Major | Intermediate |
To determine price objectives, it is also possible to use the pivot points. Here is the price position in relation to pivot points:
| Pivot points | S3 | S2 | S1 | PP | R1 | R2 | R3 |
|---|---|---|---|---|---|---|---|
| Standard | 1.3753 | 1.3769 | 1.3783 | 1.3799 | 1.3813 | 1.3829 | 1.3843 |
| Camarilla | 1.3789 | 1.3792 | 1.3794 | 1.3797 | 1.3800 | 1.3803 | 1.3805 |
| Woodie | 1.3752 | 1.3769 | 1.3782 | 1.3799 | 1.3812 | 1.3829 | 1.3842 |
| Fibonacci | 1.3769 | 1.3781 | 1.3788 | 1.3799 | 1.3811 | 1.3818 | 1.3829 |
| Pivot points | S3 | S2 | S1 | PP | R1 | R2 | R3 |
|---|---|---|---|---|---|---|---|
| Standard | 1.3658 | 1.3702 | 1.3750 | 1.3794 | 1.3842 | 1.3886 | 1.3934 |
| Camarilla | 1.3772 | 1.3780 | 1.3789 | 1.3797 | 1.3805 | 1.3814 | 1.3822 |
| Woodie | 1.3659 | 1.3703 | 1.3751 | 1.3795 | 1.3843 | 1.3887 | 1.3935 |
| Fibonacci | 1.3702 | 1.3738 | 1.3759 | 1.3794 | 1.3830 | 1.3851 | 1.3886 |
| Pivot points | S3 | S2 | S1 | PP | R1 | R2 | R3 |
|---|---|---|---|---|---|---|---|
| Standard | 1.3185 | 1.3302 | 1.3414 | 1.3531 | 1.3643 | 1.3760 | 1.3872 |
| Camarilla | 1.3463 | 1.3484 | 1.3505 | 1.3526 | 1.3547 | 1.3568 | 1.3589 |
| Woodie | 1.3183 | 1.3301 | 1.3412 | 1.3530 | 1.3641 | 1.3759 | 1.3870 |
| Fibonacci | 1.3302 | 1.3390 | 1.3444 | 1.3531 | 1.3619 | 1.3673 | 1.3760 |
Numerical data
The following are the details of the technical indicators and moving averages that were collected to generate this technical analysis:
| RSI (14): | 64.11 | |
| MACD (12,26,9): | 0.0006 | |
| Directional Movement: | 11.8200 | |
| AROON (14): | 78.5714 | |
| DEMA (21): | 1.3815 | |
| Parabolic SAR (0,02-0,02-0,2): | 1.3808 | |
| Elder Ray (13): | 0.0004 | |
| Super Trend (3,10): | 1.3795 | |
| Zig ZAG (10): | 1.3818 | |
| VORTEX (21): | 1.1314 | |
| Stochastique (14,3,5): | 81.94 | |
| TEMA (21): | 1.3816 | |
| Williams %R (14): | -8.33 | |
| Chande Momentum Oscillator (20): | 0.0016 | |
| Repulse (5,40,3): | 0.0690 | |
| ROCnROLL: | 1 | |
| TRIX (15,9): | 0.0049 | |
| Courbe Coppock: | 0.17 |
| MA7: | 1.3788 | |
| MA20: | 1.3639 | |
| MA50: | 1.3599 | |
| MA100: | 1.3661 | |
| MAexp7: | 1.3814 | |
| MAexp20: | 1.3807 | |
| MAexp50: | 1.3799 | |
| MAexp100: | 1.3787 | |
| Price / MA7: | +0.24% | |
| Price / MA20: | +1.33% | |
| Price / MA50: | +1.63% | |
| Price / MA100: | +1.17% | |
| Price / MAexp7: | +0.05% | |
| Price / MAexp20: | +0.10% | |
| Price / MAexp50: | +0.16% | |
| Price / MAexp100: | +0.25% |
News
Don't forget to follow the news on USD/CAD. At the time of publication of this analysis, the latest news was as follows:
-
10/16/2024 - 15:41
 USD/CAD Forecast October 17, 2024
-
10/03/2024 - 14:36
USD/CAD Forecast October 4, 2024
-
10/01/2024 - 16:33
USD/CAD Forecast October 2, 2024
-
09/26/2024 - 15:28
USD/CAD Forecast September 27, 2024
-
09/24/2024 - 18:04
USD/CAD Forecast September 25, 2024
About author

Online


Add a comment
Comments
0 comments on the analysis USD/CAD - 1H