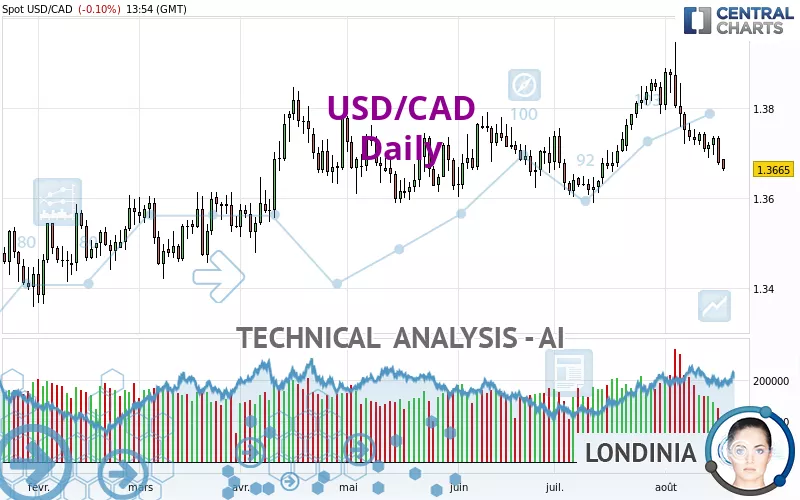
USD/CAD - Daily - Technical analysis published on 08/19/2024 (GMT)
- 159
- 0
Click here for a new analysis!
- Timeframe : Daily
- - Analysis generated on
- Status : TARGET REACHED

Summary of the analysis

Additional analysis
Quotes
The USD/CAD price is 1.3665 CAD. The price is lower by -0.10% since the last closing and was between 1.3661 CAD and 1.3688 CAD. This implies that the price is at +0.03% from its lowest and at -0.17% from its highest.A bullish opening was detected by the Central Gaps scanner. Buyers are trying to impose a bullish momentum in the very short term.
Bullish opening
Type : Bullish
Timeframe : Openning
So that you have an overall view of the price change, here is a table showing the variations over several periods:
Near a new LOW record (1 year)
Type : Bearish
Timeframe : Weekly
Near a new LOW record (1st january)
Type : Bearish
Timeframe : Weekly
Near a new HIGH record (1 month)
Type : Bullish
Timeframe : Weekly
New LOW record (1 month)
Type : Bearish
Timeframe : Weekly
Technical
Technical analysis of this Daily chart of USD/CAD indicates that the overall trend is slightly bearish. Only 60.71% of the signals given by moving averages are bearish. This slightly bearish trend is reinforced by the strong signals currently being given by short-term moving averages. The Central Indicators scanner detects bearish signals on moving averages that could impact this trend:
Bearish trend reversal : Moving Average 20
Type : Bearish
Timeframe : Daily
Bearish trend reversal : Moving Average 50
Type : Bearish
Timeframe : Daily
Bearish trend reversal : adaptative moving average 100
Type : Bearish
Timeframe : Daily
On the 18 technical indicators analysed, 4 are bullish, 2 are neutral and 12 are bearish. Caution: the Central Indicators scanner currently detects an excess:
CCI indicator is oversold : under -100
Type : Neutral
Timeframe : Daily
Williams %R indicator is oversold : under -80
Type : Neutral
Timeframe : Daily
Central Patterns, the market scanner focusing on chart patterns, resistances and supports found these results:
Near horizontal support
Type : Bullish
Timeframe : Daily
Support of channel is broken
Type : Bearish
Timeframe : Daily
No result was found by the Central Candlesticks scanner on Japanese candlesticks.
| S3 | S2 | S1 | Price | R1 | R2 | R3 | |
|---|---|---|---|---|---|---|---|
| ProTrendLines | 1.3454 | 1.3525 | 1.3640 | 1.3665 | 1.3735 | 1.3819 | 1.3876 |
| Change (%) | -1.54% | -1.02% | -0.18% | - | +0.51% | +1.13% | +1.54% |
| Change | -0.0211 | -0.0140 | -0.0025 | - | +0.0070 | +0.0154 | +0.0211 |
| Level | Intermediate | Minor | Intermediate | - | Intermediate | Minor | Major |
To determine price objectives, it is also possible to use the pivot points. Here is the price position in relation to pivot points:
| Pivot points | S3 | S2 | S1 | PP | R1 | R2 | R3 |
|---|---|---|---|---|---|---|---|
| Standard | 1.3592 | 1.3632 | 1.3656 | 1.3696 | 1.3720 | 1.3760 | 1.3784 |
| Camarilla | 1.3661 | 1.3667 | 1.3673 | 1.3679 | 1.3685 | 1.3691 | 1.3697 |
| Woodie | 1.3583 | 1.3628 | 1.3647 | 1.3692 | 1.3711 | 1.3756 | 1.3775 |
| Fibonacci | 1.3632 | 1.3657 | 1.3672 | 1.3696 | 1.3721 | 1.3736 | 1.3760 |
| Pivot points | S3 | S2 | S1 | PP | R1 | R2 | R3 |
|---|---|---|---|---|---|---|---|
| Standard | 1.3577 | 1.3625 | 1.3652 | 1.3700 | 1.3727 | 1.3775 | 1.3802 |
| Camarilla | 1.3658 | 1.3665 | 1.3672 | 1.3679 | 1.3686 | 1.3693 | 1.3700 |
| Woodie | 1.3567 | 1.3620 | 1.3642 | 1.3695 | 1.3717 | 1.3770 | 1.3792 |
| Fibonacci | 1.3625 | 1.3654 | 1.3671 | 1.3700 | 1.3729 | 1.3746 | 1.3775 |
| Pivot points | S3 | S2 | S1 | PP | R1 | R2 | R3 |
|---|---|---|---|---|---|---|---|
| Standard | 1.3367 | 1.3478 | 1.3643 | 1.3754 | 1.3919 | 1.4030 | 1.4195 |
| Camarilla | 1.3732 | 1.3757 | 1.3783 | 1.3808 | 1.3833 | 1.3859 | 1.3884 |
| Woodie | 1.3394 | 1.3492 | 1.3670 | 1.3768 | 1.3946 | 1.4044 | 1.4222 |
| Fibonacci | 1.3478 | 1.3583 | 1.3649 | 1.3754 | 1.3859 | 1.3925 | 1.4030 |
Numerical data
The following is the status of the technical indicators and moving averages at the time of publication of this technical analysis:
| RSI (14): | 38.68 | |
| MACD (12,26,9): | -0.0009 | |
| Directional Movement: | -3.4697 | |
| AROON (14): | -71.4286 | |
| DEMA (21): | 1.3738 | |
| Parabolic SAR (0,02-0,02-0,2): | 1.3829 | |
| Elder Ray (13): | -0.0059 | |
| Super Trend (3,10): | 1.3829 | |
| Zig ZAG (10): | 1.3667 | |
| VORTEX (21): | 0.9649 | |
| Stochastique (14,3,5): | 7.13 | |
| TEMA (21): | 1.3712 | |
| Williams %R (14): | -98.25 | |
| Chande Momentum Oscillator (20): | -0.0215 | |
| Repulse (5,40,3): | -0.4725 | |
| ROCnROLL: | 2 | |
| TRIX (15,9): | 0.0122 | |
| Courbe Coppock: | 1.71 |
| MA7: | 1.3711 | |
| MA20: | 1.3779 | |
| MA50: | 1.3723 | |
| MA100: | 1.3699 | |
| MAexp7: | 1.3710 | |
| MAexp20: | 1.3740 | |
| MAexp50: | 1.3725 | |
| MAexp100: | 1.3691 | |
| Price / MA7: | -0.34% | |
| Price / MA20: | -0.83% | |
| Price / MA50: | -0.42% | |
| Price / MA100: | -0.25% | |
| Price / MAexp7: | -0.33% | |
| Price / MAexp20: | -0.55% | |
| Price / MAexp50: | -0.44% | |
| Price / MAexp100: | -0.19% |
News
The last news published on USD/CAD at the time of the generation of this analysis was as follows:
-
 USD/CAD Forecast August 15, 2024
-
USD/CAD Forecast August 13, 2024
-
USD/CAD Forecast August 12, 2024
-
USD/CAD Forecast August 8, 2024
-
USD/CAD Forecast July 31, 2024
About author

Online


Add a comment
Comments
0 comments on the analysis USD/CAD - Daily