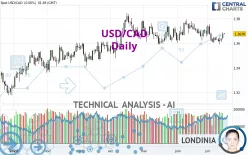
USD/CAD - Daily - Technical analysis published on 07/16/2024 (GMT)
- 213
- 0
Click here for a new analysis!
- Timeframe : Daily
- - Analysis generated on
- Status : TARGET REACHED

Summary of the analysis

Additional analysis
Quotes
The USD/CAD price is 1.3678 CAD. The price has increased by +0.00% since the last closing and was traded between 1.3674 CAD and 1.3685 CAD over the period. The price is currently at +0.03% from its lowest and -0.05% from its highest.So that you have an overall view of the price change, here is a table showing the variations over several periods:
Near a new LOW record (1 year)
Type : Bearish
Timeframe : Weekly
Near a new LOW record (1st january)
Type : Bearish
Timeframe : Weekly
Near a new HIGH record (1 month)
Type : Bullish
Timeframe : Weekly
Technical
A technical analysis in Daily of this USD/CAD chart shows a bullish trend. 75.00% of the signals given by moving averages are bullish. The overall trend seems to be showing some signs of weakness, as do the tentative bullish signals given by short-term moving averages. The Central Indicators market scanner is currently detecting several bullish signals that could impact this trend:
Bullish trend reversal : adaptative moving average 20
Type : Bullish
Timeframe : Daily
Bullish trend reversal : adaptative moving average 50
Type : Bullish
Timeframe : Daily
Bullish trend reversal : adaptative moving average 100
Type : Bullish
Timeframe : Daily
The probability of a further increase are moderate given the direction of the technical indicators.
Other results related to technical indicators were also found by the Central Indicators scanner:
Pivot points : price is over resistance 1
Type : Neutral
Timeframe : Weekly
MACD crosses UP its Moving Average
Type : Bullish
Timeframe : Daily
Momentum indicator is back over 0
Type : Bullish
Timeframe : Daily
The Central Patterns scanner, which studies chart patterns, resistances and supports, has identified this signal:
Near support of triangle
Type : Bullish
Timeframe : Daily
The Central Candlesticks scanner, specialised in Japanese candlesticks, did not identify any signals.
| S3 | S2 | S1 | Price | R1 | R2 | R3 | |
|---|---|---|---|---|---|---|---|
| ProTrendLines | 1.3454 | 1.3525 | 1.3640 | 1.3678 | 1.3735 | 1.3819 | 1.3876 |
| Change (%) | -1.64% | -1.12% | -0.28% | - | +0.42% | +1.03% | +1.45% |
| Change | -0.0224 | -0.0153 | -0.0038 | - | +0.0057 | +0.0141 | +0.0198 |
| Level | Minor | Minor | Major | - | Intermediate | Intermediate | Major |
To determine price objectives, it is also possible to use the pivot points. Here is the price position in relation to pivot points:
| Pivot points | S3 | S2 | S1 | PP | R1 | R2 | R3 |
|---|---|---|---|---|---|---|---|
| Standard | 1.3585 | 1.3608 | 1.3643 | 1.3666 | 1.3701 | 1.3724 | 1.3759 |
| Camarilla | 1.3662 | 1.3667 | 1.3673 | 1.3678 | 1.3683 | 1.3689 | 1.3694 |
| Woodie | 1.3591 | 1.3611 | 1.3649 | 1.3669 | 1.3707 | 1.3727 | 1.3765 |
| Fibonacci | 1.3608 | 1.3630 | 1.3644 | 1.3666 | 1.3688 | 1.3702 | 1.3724 |
| Pivot points | S3 | S2 | S1 | PP | R1 | R2 | R3 |
|---|---|---|---|---|---|---|---|
| Standard | 1.3542 | 1.3565 | 1.3602 | 1.3625 | 1.3662 | 1.3685 | 1.3722 |
| Camarilla | 1.3622 | 1.3627 | 1.3633 | 1.3638 | 1.3644 | 1.3649 | 1.3655 |
| Woodie | 1.3548 | 1.3569 | 1.3608 | 1.3629 | 1.3668 | 1.3689 | 1.3728 |
| Fibonacci | 1.3565 | 1.3588 | 1.3602 | 1.3625 | 1.3648 | 1.3662 | 1.3685 |
| Pivot points | S3 | S2 | S1 | PP | R1 | R2 | R3 |
|---|---|---|---|---|---|---|---|
| Standard | 1.3402 | 1.3502 | 1.3591 | 1.3691 | 1.3780 | 1.3880 | 1.3969 |
| Camarilla | 1.3627 | 1.3644 | 1.3662 | 1.3679 | 1.3696 | 1.3714 | 1.3731 |
| Woodie | 1.3396 | 1.3499 | 1.3585 | 1.3688 | 1.3774 | 1.3877 | 1.3963 |
| Fibonacci | 1.3502 | 1.3575 | 1.3619 | 1.3691 | 1.3764 | 1.3808 | 1.3880 |
Numerical data
The following are the details of the technical indicators and moving averages that were collected to generate this technical analysis:
| RSI (14): | 52.25 | |
| MACD (12,26,9): | -0.0010 | |
| Directional Movement: | 1.0332 | |
| AROON (14): | -50.0000 | |
| DEMA (21): | 1.3650 | |
| Parabolic SAR (0,02-0,02-0,2): | 1.3689 | |
| Elder Ray (13): | 0.0023 | |
| Super Trend (3,10): | 1.3586 | |
| Zig ZAG (10): | 1.3680 | |
| VORTEX (21): | 0.9616 | |
| Stochastique (14,3,5): | 45.78 | |
| TEMA (21): | 1.3640 | |
| Williams %R (14): | -45.78 | |
| Chande Momentum Oscillator (20): | 0.0000 | |
| Repulse (5,40,3): | 0.2843 | |
| ROCnROLL: | 1 | |
| TRIX (15,9): | -0.0124 | |
| Courbe Coppock: | 0.68 |
| MA7: | 1.3643 | |
| MA20: | 1.3665 | |
| MA50: | 1.3675 | |
| MA100: | 1.3644 | |
| MAexp7: | 1.3655 | |
| MAexp20: | 1.3663 | |
| MAexp50: | 1.3666 | |
| MAexp100: | 1.3640 | |
| Price / MA7: | +0.26% | |
| Price / MA20: | +0.10% | |
| Price / MA50: | +0.02% | |
| Price / MA100: | +0.25% | |
| Price / MAexp7: | +0.17% | |
| Price / MAexp20: | +0.11% | |
| Price / MAexp50: | +0.09% | |
| Price / MAexp100: | +0.28% |
News
The last news published on USD/CAD at the time of the generation of this analysis was as follows:
-
 USD/CAD Forecast July 16, 2024
-
USD/CAD Forecast July 10, 2024
-
USD/CAD Forecast July 5, 2024
-
USD/CAD Forecast July 3, 2024
-
USD/CAD Forecast June 24, 2024
About author

Online


Add a comment
Comments
0 comments on the analysis USD/CAD - Daily