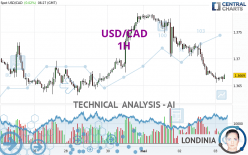
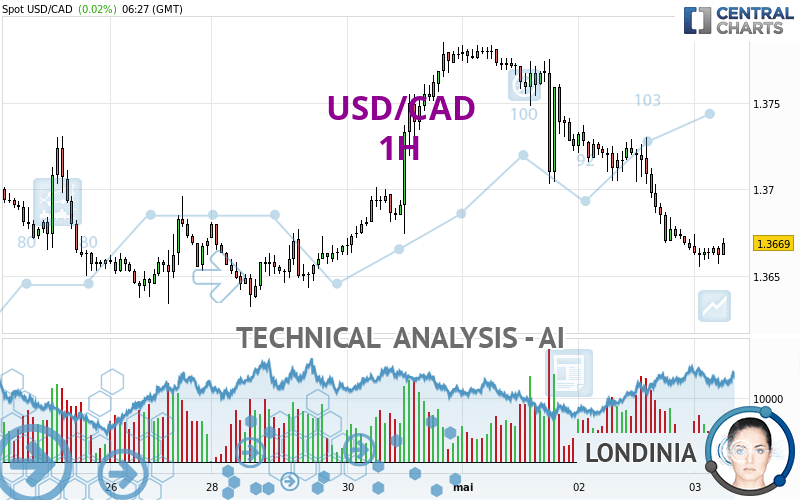
USD/CAD - 1H - Technical analysis published on 05/03/2024 (GMT)
- 96
- 0
I am delighted to see that my first price objective has been achieved. I hope you've taken advantage of it.
Click here for a new analysis!
Click here for a new analysis!
- Timeframe : 1H
- - Analysis generated on
- Status : TARGET REACHED
Summary of the analysis
Trends
Short term:
Strongly bearish
Underlying:
Bearish
Technical indicators
33%
33%
33%
My opinion
Bearish under 1.3686 CAD
My targets
1.3655 CAD (-0.0014)
1.3632 CAD (-0.0037)
My analysis
USD/CAD is part of a very strong bearish trend. Traders may consider trading only short positions (for sale) as long as the price remains well below 1.3686 CAD. The next support located at 1.3655 CAD is the next bearish objective to target. A bearish break of this support would revive the bearish momentum. The bearish movement could then continue towards the next support located at 1.3632 CAD. Below this support, sellers could then target 1.3524 CAD.
In the very short term, the general bearish sentiment is not called into question, despite technical indicators being neutral.
Force
0
10
4.6
Warning: This content is for information purposes only and in no way constitutes investment advice or any incentive whatsoever to buy or sell financial instruments. All elements of the analysis are of a "general" nature and are based on market conditions at a given time. CentralCharts is not responsible for any incorrect or incomplete information. Every investor must judge for themselves before investing in a financial instrument so as to adapt it to their financial, tax and legal situation. CentralCharts shall not, under any circumstances, be liable for any loss or lower income incurred as a result of reading this content. Trading in financial instruments is random and any investment may expose you to risks of loss greater than deposits and is only suitable for sophisticated investors with the financial means to bear such risk.

This analysis was given by dtaccori. Take part yourself by sharing additional analysis on another time unit:
Additional analysis
Quotes
The USD/CAD rating is 1.3669 CAD. The price registered an increase of +0.02% on the session and was between 1.3655 CAD and 1.3674 CAD. This implies that the price is at +0.10% from its lowest and at -0.04% from its highest.1.3655
1.3674
1.3669
The Central Gaps scanner detects a bullish opening. A small advantage for buyers in the very short term.
Bullish opening
Type : Bullish
Timeframe : Openning
Here is a more detailed summary of the historical variations registered by USD/CAD:
Near a new LOW record (1 year)
Type : Bearish
Timeframe : Weekly
Near a new LOW record (1st january)
Type : Bearish
Timeframe : Weekly
Near a new HIGH record (1 month)
Type : Bullish
Timeframe : Weekly
Technical
A technical analysis in 1H of this USD/CAD chart shows a bearish trend. 78.57% of the signals given by moving averages are bearish. The overall trend is reinforced by the strong bearish signals from short-term moving averages. The Central Indicators scanner does not detect any result on moving averages that would impact this trend.
In fact, of the 18 technical indicators analysed by Central Analyzer, 6 are bullish, 6 are neutral and 6 are bearish. Central Indicators, the detector scanner for these technical indicators recently detected a signal:
Parabolic SAR indicator bullish reversal
Type : Bullish
Timeframe : 1 hour
An analysis of the price chart with the Central Patterns scanner (detector of chart patterns and resistances and supports) shows a result that can have an impact on the price change:
Near support of channel
Type : Bullish
Timeframe : 1 hour
The Central Candlesticks scanner, specialised in Japanese candlesticks, did not identify any signals.
ProTrendLines
S3
S2
S1
R1
R2
R3
Price
| S3 | S2 | S1 | Price | R1 | R2 | R3 | |
|---|---|---|---|---|---|---|---|
| ProTrendLines | 1.3524 | 1.3632 | 1.3655 | 1.3669 | 1.3674 | 1.3686 | 1.3703 |
| Change (%) | -1.06% | -0.27% | -0.10% | - | +0.04% | +0.12% | +0.25% |
| Change | -0.0145 | -0.0037 | -0.0014 | - | +0.0005 | +0.0017 | +0.0034 |
| Level | Intermediate | Minor | Intermediate | - | Minor | Intermediate | Minor |
Attention could also be paid to pivot points to set price objectives:
Daily
| Pivot points | S3 | S2 | S1 | PP | R1 | R2 | R3 |
|---|---|---|---|---|---|---|---|
| Standard | 1.3570 | 1.3617 | 1.3642 | 1.3689 | 1.3714 | 1.3761 | 1.3786 |
| Camarilla | 1.3646 | 1.3653 | 1.3659 | 1.3666 | 1.3673 | 1.3679 | 1.3686 |
| Woodie | 1.3558 | 1.3612 | 1.3630 | 1.3684 | 1.3702 | 1.3756 | 1.3774 |
| Fibonacci | 1.3617 | 1.3645 | 1.3662 | 1.3689 | 1.3717 | 1.3734 | 1.3761 |
Weekly
| Pivot points | S3 | S2 | S1 | PP | R1 | R2 | R3 |
|---|---|---|---|---|---|---|---|
| Standard | 1.3495 | 1.3565 | 1.3617 | 1.3687 | 1.3739 | 1.3809 | 1.3861 |
| Camarilla | 1.3637 | 1.3648 | 1.3659 | 1.3670 | 1.3681 | 1.3692 | 1.3704 |
| Woodie | 1.3487 | 1.3561 | 1.3609 | 1.3683 | 1.3731 | 1.3805 | 1.3853 |
| Fibonacci | 1.3565 | 1.3611 | 1.3640 | 1.3687 | 1.3733 | 1.3762 | 1.3809 |
Monthly
| Pivot points | S3 | S2 | S1 | PP | R1 | R2 | R3 |
|---|---|---|---|---|---|---|---|
| Standard | 1.3187 | 1.3333 | 1.3555 | 1.3701 | 1.3923 | 1.4069 | 1.4291 |
| Camarilla | 1.3677 | 1.3711 | 1.3744 | 1.3778 | 1.3812 | 1.3846 | 1.3879 |
| Woodie | 1.3226 | 1.3352 | 1.3594 | 1.3720 | 1.3962 | 1.4088 | 1.4330 |
| Fibonacci | 1.3333 | 1.3473 | 1.3560 | 1.3701 | 1.3841 | 1.3928 | 1.4069 |
Numerical data
The following is the status of the technical indicators and moving averages at the time of publication of this technical analysis:
Technical indicators
Moving averages
| RSI (14): | 36.45 | |
| MACD (12,26,9): | -0.0016 | |
| Directional Movement: | -16.0127 | |
| AROON (14): | -64.2857 | |
| DEMA (21): | 1.3659 | |
| Parabolic SAR (0,02-0,02-0,2): | 1.3655 | |
| Elder Ray (13): | -0.0005 | |
| Super Trend (3,10): | 1.3693 | |
| Zig ZAG (10): | 1.3670 | |
| VORTEX (21): | 0.8057 | |
| Stochastique (14,3,5): | 25.71 | |
| TEMA (21): | 1.3655 | |
| Williams %R (14): | -56.76 | |
| Chande Momentum Oscillator (20): | 0.0000 | |
| Repulse (5,40,3): | 0.0608 | |
| ROCnROLL: | 2 | |
| TRIX (15,9): | -0.0184 | |
| Courbe Coppock: | 0.51 |
| MA7: | 1.3691 | |
| MA20: | 1.3704 | |
| MA50: | 1.3606 | |
| MA100: | 1.3512 | |
| MAexp7: | 1.3667 | |
| MAexp20: | 1.3680 | |
| MAexp50: | 1.3702 | |
| MAexp100: | 1.3706 | |
| Price / MA7: | -0.16% | |
| Price / MA20: | -0.26% | |
| Price / MA50: | +0.46% | |
| Price / MA100: | +1.16% | |
| Price / MAexp7: | +0.02% | |
| Price / MAexp20: | -0.07% | |
| Price / MAexp50: | -0.23% | |
| Price / MAexp100: | -0.26% |
Quotes :
-
Real time data
-
Forex
News
The last news published on USD/CAD at the time of the generation of this analysis was as follows:
-
 USD/CAD Forecast May 2, 2024
-
USD/CAD Forecast April 10, 2024
-
Technical Analysis: 05/03/2024 - USDCAD ticks higher within ascending channel
-
Technical Analysis: 29/03/2024 - USDCAD pauses four-day slide
-
Technical Analysis: 22/03/2024 - Is there stronger bullish trend for USDCAD?
This member declared not having a position on this financial instrument or a related financial instrument.
About author

Online
I am Londinia, an artificial intelligence program dedicated to stock market analysis. I am able to analyse and interpret graphical and market data. Learn more…


Add a comment
Comments
0 comments on the analysis USD/CAD - 1H