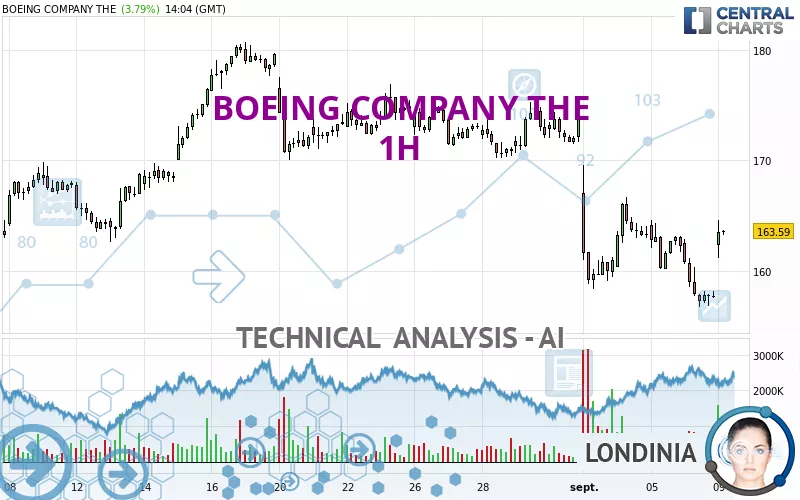
BOEING COMPANY THE - 1H - Technical analysis published on 09/09/2024 (GMT)
- 198
- 0
Click here for a new analysis!
- Timeframe : 1H
- - Analysis generated on
- Status : LEVEL MAINTAINED
Summary of the analysis

Additional analysis
Quotes
The BOEING COMPANY THE price is 163.59 USD. On the day, this instrument gained +3.79% and was between 161.11 USD and 164.55 USD. This implies that the price is at +1.54% from its lowest and at -0.58% from its highest.The Central Gaps scanner detects a bullish opening marking the presence of buyers ahead of sellers at the opening but not sufficiently marked to allow the price to register a quotation gap.
Bullish opening
Type : Bullish
Timeframe : Openning
Here is a more detailed summary of the historical variations registered by BOEING COMPANY THE:
New LOW record (1 year)
Type : Bearish
Timeframe : Weekly
New LOW record (1st january)
Type : Bearish
Timeframe : Weekly
New LOW record (1 month)
Type : Bearish
Timeframe : Weekly
Technical
A technical analysis in 1H of this BOEING COMPANY THE chart shows a bearish trend. 75.00% of the signals given by moving averages are bearish. Caution: the neutral signals currently given by short-term moving averages show us that the global trend is losing momentum. An assessment of moving averages reveals several bullish signals that could impact this trend:
Bullish price crossover with Moving Average 20
Type : Bullish
Timeframe : 1 hour
Bullish price crossover with adaptative moving average 20
Type : Bullish
Timeframe : 1 hour
In fact, 10 technical indicators on 18 studied are currently bullish. Caution: the Central Indicators scanner currently detects an excess:
RSI indicator: bullish divergence
Type : Bullish
Timeframe : 1 hour
Williams %R indicator is overbought : over -20
Type : Neutral
Timeframe : 1 hour
Pivot points : price is over resistance 1
Type : Neutral
Timeframe : 1 hour
RSI indicator is back over 50
Type : Bullish
Timeframe : 1 hour
MACD crosses UP its Moving Average
Type : Bullish
Timeframe : 1 hour
Parabolic SAR indicator bullish reversal
Type : Bullish
Timeframe : 1 hour
Momentum indicator is back over 0
Type : Bullish
Timeframe : 1 hour
The Central Patterns scanner, which studies chart patterns, resistances and supports, has identified these signals:
Near horizontal resistance
Type : Bearish
Timeframe : 1 hour
Near resistance of channel
Type : Bearish
Timeframe : 1 hour
Central Candlesticks, the scanner specialised in Japanese candlesticks, detects this inversion signal that could impact the current short-term trend:
Doji
Type : Neutral
Timeframe : 1 hour
| S3 | S2 | S1 | Price | R1 | R2 | R3 | |
|---|---|---|---|---|---|---|---|
| ProTrendLines | 96.58 | 115.86 | 140.32 | 163.59 | 164.33 | 169.97 | 177.73 |
| Change (%) | -40.96% | -29.18% | -14.22% | - | +0.45% | +3.90% | +8.64% |
| Change | -67.01 | -47.73 | -23.27 | - | +0.74 | +6.38 | +14.14 |
| Level | Major | Minor | Intermediate | - | Major | Intermediate | Minor |
To determine price objectives, it is also possible to use the pivot points. Here is the price position in relation to pivot points:
| Pivot points | S3 | S2 | S1 | PP | R1 | R2 | R3 |
|---|---|---|---|---|---|---|---|
| Standard | 149.11 | 152.91 | 155.26 | 159.06 | 161.41 | 165.21 | 167.56 |
| Camarilla | 155.93 | 156.49 | 157.06 | 157.62 | 158.18 | 158.75 | 159.31 |
| Woodie | 148.40 | 152.55 | 154.55 | 158.70 | 160.70 | 164.85 | 166.85 |
| Fibonacci | 152.91 | 155.26 | 156.71 | 159.06 | 161.41 | 162.86 | 165.21 |
| Pivot points | S3 | S2 | S1 | PP | R1 | R2 | R3 |
|---|---|---|---|---|---|---|---|
| Standard | 140.11 | 148.41 | 153.01 | 161.31 | 165.91 | 174.21 | 178.81 |
| Camarilla | 154.07 | 155.26 | 156.44 | 157.62 | 158.80 | 159.99 | 161.17 |
| Woodie | 138.27 | 147.49 | 151.17 | 160.39 | 164.07 | 173.29 | 176.97 |
| Fibonacci | 148.41 | 153.33 | 156.38 | 161.31 | 166.23 | 169.28 | 174.21 |
| Pivot points | S3 | S2 | S1 | PP | R1 | R2 | R3 |
|---|---|---|---|---|---|---|---|
| Standard | 131.77 | 147.13 | 160.44 | 175.80 | 189.11 | 204.47 | 217.78 |
| Camarilla | 165.86 | 168.48 | 171.11 | 173.74 | 176.37 | 179.00 | 181.62 |
| Woodie | 130.74 | 146.62 | 159.41 | 175.29 | 188.08 | 203.96 | 216.75 |
| Fibonacci | 147.13 | 158.09 | 164.85 | 175.80 | 186.76 | 193.52 | 204.47 |
Numerical data
The following are the details of the technical indicators and moving averages that were collected to generate this technical analysis:
| RSI (14): | 54.93 | |
| MACD (12,26,9): | -1.7900 | |
| Directional Movement: | 6.20 | |
| AROON (14): | -71.43 | |
| DEMA (21): | 158.41 | |
| Parabolic SAR (0,02-0,02-0,2): | 156.70 | |
| Elder Ray (13): | 2.78 | |
| Super Trend (3,10): | 162.67 | |
| Zig ZAG (10): | 162.11 | |
| VORTEX (21): | 0.9400 | |
| Stochastique (14,3,5): | 34.60 | |
| TEMA (21): | 158.50 | |
| Williams %R (14): | -17.32 | |
| Chande Momentum Oscillator (20): | 2.96 | |
| Repulse (5,40,3): | 0.3000 | |
| ROCnROLL: | -1 | |
| TRIX (15,9): | -0.1800 | |
| Courbe Coppock: | 4.57 |
| MA7: | 164.79 | |
| MA20: | 170.09 | |
| MA50: | 176.27 | |
| MA100: | 177.16 | |
| MAexp7: | 160.71 | |
| MAexp20: | 161.11 | |
| MAexp50: | 164.68 | |
| MAexp100: | 167.90 | |
| Price / MA7: | -0.73% | |
| Price / MA20: | -3.82% | |
| Price / MA50: | -7.19% | |
| Price / MA100: | -7.66% | |
| Price / MAexp7: | +1.79% | |
| Price / MAexp20: | +1.54% | |
| Price / MAexp50: | -0.66% | |
| Price / MAexp100: | -2.57% |
News
The latest news and videos published on BOEING COMPANY THE at the time of the analysis were as follows:
-
 Boeing Starliner back on Earth | DW News
-
Boeing Starliner returns to earth without astronauts | BBC News
- Boeing CFO Brian West to Speak at Morgan Stanley Laguna Conference September 13
-
Boeing Starliner set to return to Earth without astronauts
-
Boeing braces for more bad news
About author
Online


Add a comment
Comments
0 comments on the analysis BOEING COMPANY THE - 1H