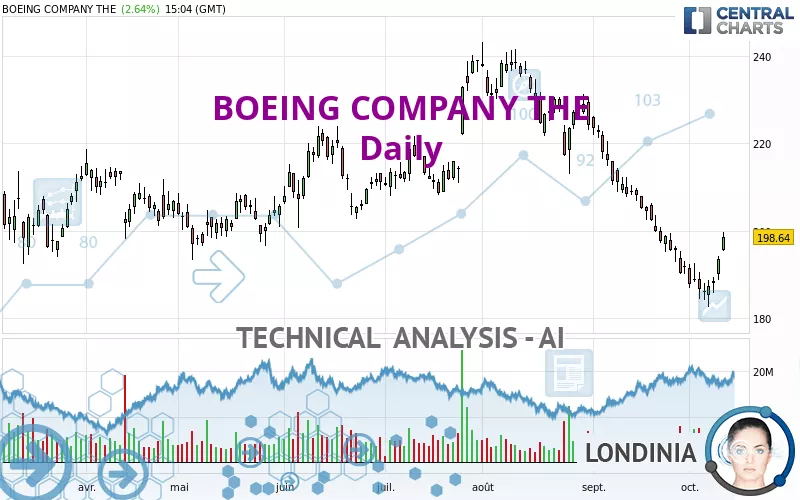
BOEING COMPANY THE - Daily - Technical analysis published on 10/11/2023 (GMT)
- 182
- 0
Click here for a new analysis!
- Timeframe : Daily
- - Analysis generated on
- Status : TARGET REACHED

Summary of the analysis

Additional analysis
Quotes
The BOEING COMPANY THE rating is 198.67 USD. On the day, this instrument gained +2.66% and was traded between 195.35 USD and 199.62 USD over the period. The price is currently at +1.70% from its lowest and -0.48% from its highest.The Central Gaps scanner detects the formation of a bullish gap marking the strong presence of buyers against sellers at the opening. This formed a quotation gap.
Opening Gap UP
Type : Bullish
Timeframe : Openning
A study of price movements over other periods shows the following variations:
Technical
Technical analysis of this Daily chart of BOEING COMPANY THE indicates that the overall trend is bearish. 71.43% of the signals given by moving averages are bearish. Caution: as the signals currently given by short-term moving averages are rather neutral, the bearish trend could slow down. The Central Indicators market scanner is currently detecting a bullish signal that could impact this trend:
Bullish price crossover with Moving Average 20
Type : Bullish
Timeframe : Daily
The probability of a further increase are moderate given the direction of the technical indicators.
Caution: the Central Indicators scanner currently detects an excess:
Williams %R indicator is overbought : over -20
Type : Neutral
Timeframe : Daily
Pivot points : price is over resistance 2
Type : Neutral
Timeframe : Daily
Pivot points : price is over resistance 2
Type : Neutral
Timeframe : Weekly
Momentum indicator is back over 0
Type : Bullish
Timeframe : Daily
The Central Patterns scanner, which studies chart patterns, resistances and supports, has identified these signals:
Near horizontal resistance
Type : Bearish
Timeframe : Daily
Near resistance of channel
Type : Bearish
Timeframe : Daily
The presence of a bullish Japanese candlestick pattern detected by Central Candlesticks that could cause a very short term rebound was also detected:
Upside gap
Type : Bullish
Timeframe : Daily
| S3 | S2 | S1 | Price | R1 | R2 | R3 | |
|---|---|---|---|---|---|---|---|
| ProTrendLines | 141.00 | 171.12 | 195.63 | 198.67 | 205.71 | 218.45 | 228.85 |
| Change (%) | -29.03% | -13.87% | -1.53% | - | +3.54% | +9.96% | +15.19% |
| Change | -57.67 | -27.55 | -3.04 | - | +7.04 | +19.78 | +30.18 |
| Level | Major | Intermediate | Intermediate | - | Intermediate | Major | Intermediate |
Attention could also be paid to pivot points to set price objectives:
| Pivot points | S3 | S2 | S1 | PP | R1 | R2 | R3 |
|---|---|---|---|---|---|---|---|
| Standard | 184.55 | 186.66 | 190.09 | 192.20 | 195.63 | 197.74 | 201.17 |
| Camarilla | 192.01 | 192.51 | 193.02 | 193.53 | 194.04 | 194.55 | 195.05 |
| Woodie | 185.22 | 186.99 | 190.76 | 192.53 | 196.30 | 198.07 | 201.84 |
| Fibonacci | 186.66 | 188.77 | 190.08 | 192.20 | 194.31 | 195.62 | 197.74 |
| Pivot points | S3 | S2 | S1 | PP | R1 | R2 | R3 |
|---|---|---|---|---|---|---|---|
| Standard | 172.52 | 177.53 | 182.46 | 187.47 | 192.40 | 197.41 | 202.34 |
| Camarilla | 184.65 | 185.56 | 186.47 | 187.38 | 188.29 | 189.20 | 190.11 |
| Woodie | 172.47 | 177.51 | 182.41 | 187.45 | 192.35 | 197.39 | 202.29 |
| Fibonacci | 177.53 | 181.33 | 183.68 | 187.47 | 191.27 | 193.62 | 197.41 |
| Pivot points | S3 | S2 | S1 | PP | R1 | R2 | R3 |
|---|---|---|---|---|---|---|---|
| Standard | 142.86 | 166.45 | 179.06 | 202.65 | 215.26 | 238.85 | 251.46 |
| Camarilla | 181.73 | 185.04 | 188.36 | 191.68 | 195.00 | 198.32 | 201.64 |
| Woodie | 137.38 | 163.71 | 173.58 | 199.91 | 209.78 | 236.11 | 245.98 |
| Fibonacci | 166.45 | 180.28 | 188.82 | 202.65 | 216.48 | 225.02 | 238.85 |
Numerical data
The following is the status of technical indicators and moving averages registered at the time this technical analysis was created:
| RSI (14): | 47.03 | |
| MACD (12,26,9): | -6.4300 | |
| Directional Movement: | -8.43 | |
| AROON (14): | -78.57 | |
| DEMA (21): | 187.76 | |
| Parabolic SAR (0,02-0,02-0,2): | 183.02 | |
| Elder Ray (13): | 3.96 | |
| Super Trend (3,10): | 199.39 | |
| Zig ZAG (10): | 197.80 | |
| VORTEX (21): | 0.8200 | |
| Stochastique (14,3,5): | 54.86 | |
| TEMA (21): | 186.61 | |
| Williams %R (14): | -12.59 | |
| Chande Momentum Oscillator (20): | -0.59 | |
| Repulse (5,40,3): | 3.5700 | |
| ROCnROLL: | -1 | |
| TRIX (15,9): | -0.5500 | |
| Courbe Coppock: | 11.90 |
| MA7: | 190.03 | |
| MA20: | 195.80 | |
| MA50: | 214.06 | |
| MA100: | 213.96 | |
| MAexp7: | 192.29 | |
| MAexp20: | 196.70 | |
| MAexp50: | 206.51 | |
| MAexp100: | 209.22 | |
| Price / MA7: | +4.55% | |
| Price / MA20: | +1.47% | |
| Price / MA50: | -7.19% | |
| Price / MA100: | -7.15% | |
| Price / MAexp7: | +3.32% | |
| Price / MAexp20: | +1.00% | |
| Price / MAexp50: | -3.80% | |
| Price / MAexp100: | -5.04% |
News
The latest news and videos published on BOEING COMPANY THE at the time of the analysis were as follows:
- Boeing Announces Third-Quarter Deliveries
- TAAG Angola Airlines to Renew Fleet with Boeing 787 Dreamliners
- SHAREHOLDER ALERT: Pomerantz Law Firm Investigates Claims on Behalf of Investors of The Boeing Company - BA
- Boeing to Release Third-Quarter Results on October 25
- United Airlines Orders 50 More Boeing 787 Dreamliners
About author
Online


Add a comment
Comments
0 comments on the analysis BOEING COMPANY THE - Daily