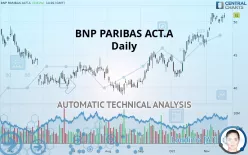
BNP PARIBAS ACT.A - Daily - Technical analysis published on 11/19/2019 (GMT)
- 376
- 0
- Who voted?
Click here for a new analysis!
- Timeframe : Daily
- - Analysis generated on
- Status : TARGET REACHED

Summary of the analysis

Additional analysis
Quotes
The BNP PARIBAS ACT.A rating is 51.000 EUR. The price registered an increase of +0.81% on the session and was between 50.630 EUR and 51.340 EUR. This implies that the price is at +0.73% from its lowest and at -0.66% from its highest.The Central Gaps scanner detects a bullish opening marking the presence of buyers ahead of sellers at the opening but not sufficiently marked to allow the price to register a quotation gap.
Bullish opening
Type : Bullish
Timeframe : Openning
Here is a more detailed summary of the historical variations registered by BNP PARIBAS ACT.A:
New HIGH record (1 year)
Type : Bullish
Timeframe : Weekly
New HIGH record (1st january)
Type : Bullish
Timeframe : Weekly
New HIGH record (1 month)
Type : Bullish
Timeframe : Weekly
Technical
Technical analysis of this Daily chart of BNP PARIBAS ACT.A indicates that the overall trend is strongly bullish. The signals given by the moving averages are 92.86% bullish. This strong bullish trend is confirmed by the strong signals currently being given by short-term moving averages. The Central Indicators market scanner currently does not detect any result that concerns moving averages.
Technical indicators are strongly bullish, suggesting that the price increase should continue.
Caution: the Central Indicators scanner currently detects an excess:
Williams %R indicator is overbought : over -20
Type : Neutral
Timeframe : Daily
MACD crosses DOWN its Moving Average
Type : Bearish
Timeframe : Daily
Price is back over the pivot point
Type : Bullish
Timeframe : Weekly
An analysis of the price chart with the Central Patterns scanner (detector of chart patterns and resistances and supports) shows a result that can have an impact on the price change:
Near resistance of channel
Type : Bearish
Timeframe : Daily
The Central Candlesticks scanner which studies Japanese candlesticks did not detect anything.
| S3 | S2 | S1 | Price | R1 | R2 | R3 | |
|---|---|---|---|---|---|---|---|
| ProTrendLines | 44.801 | 46.801 | 48.928 | 51.000 | 51.340 | 54.680 | 60.793 |
| Change (%) | -12.15% | -8.23% | -4.06% | - | +0.67% | +7.22% | +19.20% |
| Change | -6.199 | -4.199 | -2.072 | - | +0.340 | +3.680 | +9.793 |
| Level | Intermediate | Major | Major | - | Major | Minor | Major |
Pivot points can also be used to set your price objectives. Here is the price situation in relation to pivot points:
| Pivot points | S3 | S2 | S1 | PP | R1 | R2 | R3 |
|---|---|---|---|---|---|---|---|
| Standard | 48.850 | 49.390 | 49.990 | 50.530 | 51.130 | 51.670 | 52.270 |
| Camarilla | 50.277 | 50.381 | 50.486 | 50.590 | 50.695 | 50.799 | 50.904 |
| Woodie | 48.880 | 49.405 | 50.020 | 50.545 | 51.160 | 51.685 | 52.300 |
| Fibonacci | 49.390 | 49.826 | 50.095 | 50.530 | 50.966 | 51.235 | 51.670 |
| Pivot points | S3 | S2 | S1 | PP | R1 | R2 | R3 |
|---|---|---|---|---|---|---|---|
| Standard | 48.803 | 49.297 | 49.963 | 50.457 | 51.123 | 51.617 | 52.283 |
| Camarilla | 50.311 | 50.417 | 50.524 | 50.630 | 50.736 | 50.843 | 50.949 |
| Woodie | 48.890 | 49.340 | 50.050 | 50.500 | 51.210 | 51.660 | 52.370 |
| Fibonacci | 49.297 | 49.740 | 50.014 | 50.457 | 50.900 | 51.174 | 51.617 |
| Pivot points | S3 | S2 | S1 | PP | R1 | R2 | R3 |
|---|---|---|---|---|---|---|---|
| Standard | 35.928 | 38.757 | 42.783 | 45.612 | 49.638 | 52.467 | 56.493 |
| Camarilla | 44.925 | 45.553 | 46.182 | 46.810 | 47.438 | 48.067 | 48.695 |
| Woodie | 36.528 | 39.056 | 43.383 | 45.911 | 50.238 | 52.766 | 57.093 |
| Fibonacci | 38.757 | 41.375 | 42.993 | 45.612 | 48.230 | 49.848 | 52.467 |
Numerical data
The following is the status of the technical indicators and moving averages at the time of publication of this technical analysis:
| RSI (14): | 69.05 | |
| MACD (12,26,9): | 1.3640 | |
| Directional Movement: | 18.216 | |
| AROON (14): | 92.857 | |
| DEMA (21): | 51.092 | |
| Parabolic SAR (0,02-0,02-0,2): | 48.898 | |
| Elder Ray (13): | 1.029 | |
| Super Trend (3,10): | 48.142 | |
| Zig ZAG (10): | 51.030 | |
| VORTEX (21): | 1.0910 | |
| Stochastique (14,3,5): | 88.58 | |
| TEMA (21): | 51.335 | |
| Williams %R (14): | -6.35 | |
| Chande Momentum Oscillator (20): | 3.840 | |
| Repulse (5,40,3): | 1.1630 | |
| ROCnROLL: | 1 | |
| TRIX (15,9): | 0.4320 | |
| Courbe Coppock: | 12.60 |
| MA7: | 50.586 | |
| MA20: | 49.200 | |
| MA50: | 46.425 | |
| MA100: | 44.040 | |
| MAexp7: | 50.511 | |
| MAexp20: | 49.257 | |
| MAexp50: | 46.961 | |
| MAexp100: | 45.044 | |
| Price / MA7: | +0.82% | |
| Price / MA20: | +3.66% | |
| Price / MA50: | +9.85% | |
| Price / MA100: | +15.80% | |
| Price / MAexp7: | +0.97% | |
| Price / MAexp20: | +3.54% | |
| Price / MAexp50: | +8.60% | |
| Price / MAexp100: | +13.22% |
News
Don"t forget to follow the news on BNP PARIBAS ACT.A. At the time of publication of this analysis, the latest news was as follows:
- TEVA - Prestab - BNP Paribas Primary New Issues : Stabilisation Notice
- BNP Paribas, Court 16 and Helen Keller Services for the Blind Expand ‘Sound of Tennis’ Program for Visually Impaired
- BROWN - BNP Paribas Primary New Issues: NO STAB Notice
- BNP Paribas CEO Interview - 3Q 2019 Results (Video)
- Informa - No Stab - BNP Paribas Primary New Issues: NO STAB Notice
About author

Online


Add a comment
Comments
0 comments on the analysis BNP PARIBAS ACT.A - Daily