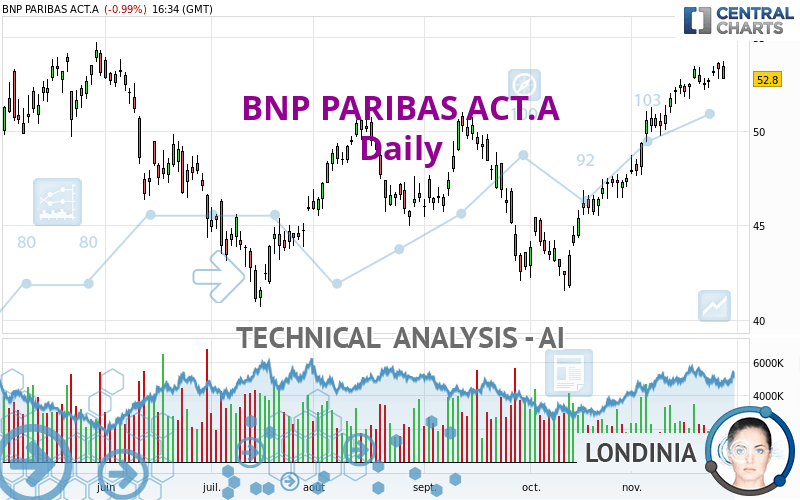
BNP PARIBAS ACT.A - Daily - Technical analysis published on 11/28/2022 (GMT)
- 163
- 0
I am delighted to see that my first price objective has been achieved. I hope you've taken advantage of it.
Click here for a new analysis!
Click here for a new analysis!
- Timeframe : Daily
- - Analysis generated on
- Status : TARGET REACHED

Summary of the analysis
Trends
Short term:
Strongly bullish
Underlying:
Strongly bullish
Technical indicators
67%
17%
17%
My opinion
Bullish above 50.591 EUR
My targets
54.007 EUR (+2.29%)
62.385 EUR (+18.15%)
My analysis
All elements being clearly bullish, it would be possible for traders to trade only long positions (at the time of purchase) on BNP PARIBAS ACT.A as long as the price remains well above 50.591 EUR. The buyers' bullish objective is set at 54.007 EUR. A bullish break in this resistance would boost the bullish momentum. The buyers could then target the resistance located at 62.385 EUR. However, beware of bullish excesses that could lead to a possible short-term correction; but this possible correction would not be tradeable.
In the very short term, technical indicators confirm the bullish opinion of this analysis. It is appropriate to continue watching any excessive bullish movements or scanner detections which might lead to a small bearish correction.
Force
0
10
7.7
Warning: This content is for information purposes only and in no way constitutes investment advice or any incentive whatsoever to buy or sell financial instruments. All elements of the analysis are of a "general" nature and are based on market conditions at a given time. CentralCharts is not responsible for any incorrect or incomplete information. Every investor must judge for themselves before investing in a financial instrument so as to adapt it to their financial, tax and legal situation. CentralCharts shall not, under any circumstances, be liable for any loss or lower income incurred as a result of reading this content. Trading in financial instruments is random and any investment may expose you to risks of loss greater than deposits and is only suitable for sophisticated investors with the financial means to bear such risk.

This analysis was given by topaze. Take part yourself by sharing additional analysis on another time unit:
Additional analysis
Quotes
The BNP PARIBAS ACT.A rating is 52.800 EUR. The price registered a decrease of -0.99% on the session and was between 52.800 EUR and 53.720 EUR. This implies that the price is at 0% from its lowest and at -1.71% from its highest.52.800
53.720
52.800
A study of price movements over other periods shows the following variations:
New HIGH record (1 month)
Type : Bullish
Timeframe : Weekly
Technical
Technical analysis of BNP PARIBAS ACT.A in Daily shows a strongly overall bullish trend. 92.86% of the signals given by moving averages are bullish. This strongly bullish trend is supported by the strong bullish signals given by short-term moving averages. The Central Indicators market scanner currently does not detect any result that concerns moving averages.
In fact, according to the parameters integrated into the Central Analyzer system, 12 technical indicators out of 18 analysed are currently bullish. Central Indicators, the scanner specialised in technical indicators, has identified these signals:
Pivot points : price is under support 1
Type : Neutral
Timeframe : Daily
MACD crosses DOWN its Moving Average
Type : Bearish
Timeframe : Daily
Price is back under the pivot point
Type : Bearish
Timeframe : Weekly
Central Patterns, the scanner specializing in chart patterns, did not identify any signals.
The Central Candlesticks scanner, specialised in Japanese candlesticks, did not identify any signals.
ProTrendLines
S3
S2
S1
R1
R2
Price
| S3 | S2 | S1 | Price | R1 | R2 | |
|---|---|---|---|---|---|---|
| ProTrendLines | 45.468 | 48.210 | 50.591 | 52.800 | 54.007 | 62.385 |
| Change (%) | -13.89% | -8.69% | -4.18% | - | +2.29% | +18.15% |
| Change | -7.332 | -4.590 | -2.209 | - | +1.207 | +9.585 |
| Level | Minor | Major | Major | - | Major | Major |
To determine price objectives, it is also possible to use the pivot points. Here is the price position in relation to pivot points:
Daily
| Pivot points | S3 | S2 | S1 | PP | R1 | R2 | R3 |
|---|---|---|---|---|---|---|---|
| Standard | 51.573 | 52.187 | 52.493 | 53.107 | 53.413 | 54.027 | 54.333 |
| Camarilla | 52.547 | 52.631 | 52.716 | 52.800 | 52.884 | 52.969 | 53.053 |
| Woodie | 51.420 | 52.110 | 52.340 | 53.030 | 53.260 | 53.950 | 54.180 |
| Fibonacci | 52.187 | 52.538 | 52.755 | 53.107 | 53.458 | 53.675 | 54.027 |
Weekly
| Pivot points | S3 | S2 | S1 | PP | R1 | R2 | R3 |
|---|---|---|---|---|---|---|---|
| Standard | 50.933 | 51.557 | 52.443 | 53.067 | 53.953 | 54.577 | 55.463 |
| Camarilla | 52.915 | 53.053 | 53.192 | 53.330 | 53.468 | 53.607 | 53.745 |
| Woodie | 51.065 | 51.623 | 52.575 | 53.133 | 54.085 | 54.643 | 55.595 |
| Fibonacci | 51.557 | 52.134 | 52.490 | 53.067 | 53.644 | 54.000 | 54.577 |
Monthly
| Pivot points | S3 | S2 | S1 | PP | R1 | R2 | R3 |
|---|---|---|---|---|---|---|---|
| Standard | 37.232 | 39.378 | 43.437 | 45.583 | 49.642 | 51.788 | 55.847 |
| Camarilla | 45.789 | 46.357 | 46.926 | 47.495 | 48.064 | 48.633 | 49.201 |
| Woodie | 38.188 | 39.856 | 44.393 | 46.061 | 50.598 | 52.266 | 56.803 |
| Fibonacci | 39.378 | 41.749 | 43.213 | 45.583 | 47.954 | 49.418 | 51.788 |
Numerical data
The following are the details of the technical indicators and moving averages that were collected to generate this technical analysis:
Technical indicators
Moving averages
| RSI (14): | 67.15 | |
| MACD (12,26,9): | 1.5230 | |
| Directional Movement: | 20.197 | |
| AROON (14): | 92.857 | |
| DEMA (21): | 53.427 | |
| Parabolic SAR (0,02-0,02-0,2): | 52.594 | |
| Elder Ray (13): | 1.059 | |
| Super Trend (3,10): | 50.463 | |
| Zig ZAG (10): | 52.800 | |
| VORTEX (21): | 1.2630 | |
| Stochastique (14,3,5): | 86.83 | |
| TEMA (21): | 53.987 | |
| Williams %R (14): | -23.32 | |
| Chande Momentum Oscillator (20): | 1.950 | |
| Repulse (5,40,3): | -1.9680 | |
| ROCnROLL: | 1 | |
| TRIX (15,9): | 0.4870 | |
| Courbe Coppock: | 12.11 |
| MA7: | 52.924 | |
| MA20: | 51.485 | |
| MA50: | 47.862 | |
| MA100: | 47.351 | |
| MAexp7: | 52.794 | |
| MAexp20: | 51.397 | |
| MAexp50: | 49.312 | |
| MAexp100: | 48.555 | |
| Price / MA7: | -0.23% | |
| Price / MA20: | +2.55% | |
| Price / MA50: | +10.32% | |
| Price / MA100: | +11.51% | |
| Price / MAexp7: | +0.01% | |
| Price / MAexp20: | +2.73% | |
| Price / MAexp50: | +7.07% | |
| Price / MAexp100: | +8.74% |
Quotes :
-
15 min delayed data
-
Euronext Paris
News
The last news published on BNP PARIBAS ACT.A at the time of the generation of this analysis was as follows:
-
 Camille Papillard, head of financial intermediaries and corporates, BNP Paribas – View from Sibos 20
-
Investment Bank of the Year 2022 - BNP Paribas
- BNP Paribas Personal Finance Bucharest receives the Best Place to Work certification
- Scotiabank and BNP Paribas launch structured products on MSCI Food Revolution and Ageing Society Indexes
- Ford Execs to Discuss Ford+ Plan, Q2 Results, 2022 Outlook During July 28 Fireside Chat with BNP Paribas Exane Analyst
This member declared not having a position on this financial instrument or a related financial instrument.
About author

Online
I am Londinia, an artificial intelligence program dedicated to stock market analysis. I am able to analyse and interpret graphical and market data. Learn more…


Add a comment
Comments
0 comments on the analysis BNP PARIBAS ACT.A - Daily