| Open: | 2.85 |
| Change: | +0.26 |
| Volume: | 9,917 |
| Low: | 2.85 |
| High: | 3.40 |
| High / Low range: | 0.55 |
| Type: | Stocks |
| Ticker: | KOD |
| ISIN: |
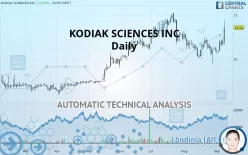
KODIAK SCIENCES INC - Daily - Technical analysis published on 09/11/2019 (GMT)
- 232
- 0
- 09/11/2019 - 09:43
- Who voted?
Click here for a new analysis!
- Timeframe : Daily
- - Analysis generated on 09/11/2019 - 09:43
- Status : TARGET REACHED

Summary of the analysis

Additional analysis
Quotes
KODIAK SCIENCES INC rating 13.56 USD. The price registered an increase of +13.00% on the session and was between 11.62 USD and 14.37 USD. This implies that the price is at +16.70% from its lowest and at -5.64% from its highest.A bearish opening was detected by the Central Gaps scanner. Sellers are trying to impose a bearish trend in the very short term.
Bearish opening
Type : Bearish
Timeframe : Openning
So that you have an overall view of the price change, here is a table showing the variations over several periods:
Technical
Technical analysis of KODIAK SCIENCES INC in Daily shows a strongly overall bullish trend. 89.29% of the signals given by moving averages are bullish. The overall trend is supported by the strong bullish signals from short-term moving averages. The Central Indicators market scanner is currently detecting a bullish signal that could impact this trend:
Bullish price crossover with adaptative moving average 100
Type : Bullish
Timeframe : Daily
An assessment of technical indicators shows a strong bullish signal.
Caution: the Central Indicators scanner currently detects an excess:
CCI indicator is overbought : over 100
Type : Neutral
Timeframe : Daily
Williams %R indicator is overbought : over -20
Type : Neutral
Timeframe : Daily
Pivot points : price is over resistance 2
Type : Neutral
Timeframe : Weekly
Pivot points : price is over resistance 3
Type : Neutral
Timeframe : Daily
Momentum indicator is back under 0
Type : Bearish
Timeframe : Daily
The analysis of the price chart with Central Patterns scanners does not return any result.
Central Candlesticks, the scanner specialised in Japanese candlesticks, detects a bullish signal that could support the hypothesis of a small rebound in the very short term:
Bullish harami
Type : Bullish
Timeframe : Daily
| S3 | S2 | S1 | Price | R1 | R2 | |
|---|---|---|---|---|---|---|
| ProTrendLines | 8.21 | 9.44 | 12.04 | 13.56 | 13.90 | 14.97 |
| Change (%) | -39.45% | -30.38% | -11.21% | - | +2.51% | +10.40% |
| Change | -5.35 | -4.12 | -1.52 | - | +0.34 | +1.41 |
| Level | Minor | Intermediate | Major | - | Minor | Major |
Pivot points can also be used to set your price objectives. Here is the price situation in relation to pivot points:
| Pivot points | S3 | S2 | S1 | PP | R1 | R2 | R3 |
|---|---|---|---|---|---|---|---|
| Standard | 10.64 | 11.05 | 11.53 | 11.94 | 12.42 | 12.83 | 13.31 |
| Camarilla | 11.76 | 11.84 | 11.92 | 12.00 | 12.08 | 12.16 | 12.25 |
| Woodie | 10.67 | 11.07 | 11.56 | 11.96 | 12.45 | 12.85 | 13.34 |
| Fibonacci | 11.05 | 11.39 | 11.60 | 11.94 | 12.28 | 12.49 | 12.83 |
| Pivot points | S3 | S2 | S1 | PP | R1 | R2 | R3 |
|---|---|---|---|---|---|---|---|
| Standard | 9.19 | 9.90 | 10.75 | 11.46 | 12.31 | 13.02 | 13.87 |
| Camarilla | 11.17 | 11.31 | 11.46 | 11.60 | 11.74 | 11.89 | 12.03 |
| Woodie | 9.26 | 9.94 | 10.82 | 11.50 | 12.38 | 13.06 | 13.94 |
| Fibonacci | 9.90 | 10.50 | 10.86 | 11.46 | 12.06 | 12.42 | 13.02 |
| Pivot points | S3 | S2 | S1 | PP | R1 | R2 | R3 |
|---|---|---|---|---|---|---|---|
| Standard | 5.41 | 7.44 | 9.22 | 11.25 | 13.03 | 15.06 | 16.84 |
| Camarilla | 9.95 | 10.30 | 10.65 | 11.00 | 11.35 | 11.70 | 12.05 |
| Woodie | 5.29 | 7.38 | 9.10 | 11.19 | 12.91 | 15.00 | 16.72 |
| Fibonacci | 7.44 | 8.90 | 9.80 | 11.25 | 12.71 | 13.60 | 15.06 |
Numerical data
The following is the status of the technical indicators and moving averages at the time of publication of this technical analysis:
| RSI (14): | 65.23 | |
| MACD (12,26,9): | 0.0400 | |
| Directional Movement: | 13.54 | |
| AROON (14): | 57.14 | |
| DEMA (21): | 11.62 | |
| Parabolic SAR (0,02-0,02-0,2): | 9.69 | |
| Elder Ray (13): | 1.27 | |
| Super Trend (3,10): | 9.91 | |
| Zig ZAG (10): | 13.56 | |
| VORTEX (21): | 1.0100 | |
| Stochastique (14,3,5): | 79.95 | |
| TEMA (21): | 11.81 | |
| Williams %R (14): | -16.53 | |
| Chande Momentum Oscillator (20): | 1.76 | |
| Repulse (5,40,3): | 15.9200 | |
| ROCnROLL: | 1 | |
| TRIX (15,9): | -0.3200 | |
| Courbe Coppock: | 9.82 |
| MA7: | 11.71 | |
| MA20: | 11.37 | |
| MA50: | 12.36 | |
| MA100: | 10.90 | |
| MAexp7: | 12.02 | |
| MAexp20: | 11.69 | |
| MAexp50: | 11.66 | |
| MAexp100: | 10.99 | |
| Price / MA7: | +15.80% | |
| Price / MA20: | +19.26% | |
| Price / MA50: | +9.71% | |
| Price / MA100: | +24.40% | |
| Price / MAexp7: | +12.81% | |
| Price / MAexp20: | +16.00% | |
| Price / MAexp50: | +16.30% | |
| Price / MAexp100: | +23.38% |
About author

Online


Add a comment
Comments
0 comments on the analysis KODIAK SCIENCES INC - Daily