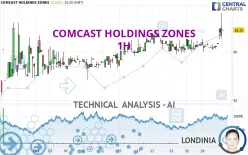
COMCAST HOLDINGS ZONES - 1H - Technical analysis published on 10/31/2024 (GMT)
- 124
- 0
Click here for a new analysis!
- Timeframe : 1H
- - Analysis generated on
- Status : INVALID

Summary of the analysis
Additional analysis
Quotes
The COMCAST HOLDINGS ZONES rating is 62.25 USD. The price registered an increase of +2.22% on the session and was traded between 61.30 USD and 64.00 USD over the period. The price is currently at +1.55% from its lowest and -2.73% from its highest.The Central Gaps scanner detects the formation of a bullish gap marking the strong presence of buyers against sellers at the opening. This formed a quotation gap.
Opening Gap UP
Type : Bullish
Timeframe : Openning
Here is a more detailed summary of the historical variations registered by COMCAST HOLDINGS ZONES:
Near a new HIGH record (1 year)
Type : Bullish
Timeframe : Weekly
Near a new HIGH record (1st january)
Type : Bullish
Timeframe : Weekly
New HIGH record (1 month)
Type : Bullish
Timeframe : Weekly
The Central Volumes scanner detects abnormal volumes on the asset:
Abnormal volumes
Timeframe : 20 days
Abnormal volumes
Timeframe : 50 days
Technical
Technical analysis of this 1H chart of COMCAST HOLDINGS ZONES indicates that the overall trend is strongly bullish. The signals given by the moving averages are 92.86% bullish. This strong bullish trend is confirmed by the strong signals currently being given by short-term moving averages. The Central Indicators scanner does not detect any result on moving averages that would impact this trend.
In fact, according to the parameters integrated into the Central Analyzer system, 15 technical indicators out of 18 analysed are currently bullish. Caution: the Central Indicators scanner currently detects an excess:
CCI indicator is overbought : over 100
Type : Neutral
Timeframe : 1 hour
Previous candle closed over Bollinger bands
Type : Neutral
Timeframe : 1 hour
Pivot points : price is over resistance 1
Type : Neutral
Timeframe : Weekly
Pivot points : price is over resistance 3
Type : Neutral
Timeframe : 1 hour
Central Patterns, the market scanner focusing on chart patterns, resistances and supports found these results:
Near horizontal resistance
Type : Bearish
Timeframe : 1 hour
Resistance of channel is broken
Type : Bullish
Timeframe : 1 hour
From the Japanese candlestick perspective, the Central Candlesticks scanner notes the presence of these results that could impact the short-term trend:
Doji
Type : Neutral
Timeframe : 1 hour
Bearish harami cross
Type : Bearish
Timeframe : 1 hour
| S3 | S2 | S1 | Price | R1 | |
|---|---|---|---|---|---|
| ProTrendLines | 60.00 | 61.31 | 62.20 | 62.25 | 62.98 |
| Change (%) | -3.61% | -1.51% | -0.08% | - | +1.17% |
| Change | -2.25 | -0.94 | -0.05 | - | +0.73 |
| Level | Intermediate | Intermediate | Intermediate | - | Minor |
Attention could also be paid to pivot points to set price objectives:
| Pivot points | S3 | S2 | S1 | PP | R1 | R2 | R3 |
|---|---|---|---|---|---|---|---|
| Standard | 59.77 | 59.99 | 60.45 | 60.67 | 61.13 | 61.35 | 61.81 |
| Camarilla | 60.71 | 60.78 | 60.84 | 60.90 | 60.96 | 61.03 | 61.09 |
| Woodie | 59.88 | 60.05 | 60.56 | 60.73 | 61.24 | 61.41 | 61.92 |
| Fibonacci | 59.99 | 60.25 | 60.41 | 60.67 | 60.93 | 61.09 | 61.35 |
| Pivot points | S3 | S2 | S1 | PP | R1 | R2 | R3 |
|---|---|---|---|---|---|---|---|
| Standard | 56.83 | 58.27 | 59.33 | 60.77 | 61.83 | 63.27 | 64.33 |
| Camarilla | 59.71 | 59.94 | 60.17 | 60.40 | 60.63 | 60.86 | 61.09 |
| Woodie | 56.65 | 58.18 | 59.15 | 60.68 | 61.65 | 63.18 | 64.15 |
| Fibonacci | 58.27 | 59.22 | 59.81 | 60.77 | 61.72 | 62.31 | 63.27 |
| Pivot points | S3 | S2 | S1 | PP | R1 | R2 | R3 |
|---|---|---|---|---|---|---|---|
| Standard | 49.99 | 53.49 | 55.98 | 59.48 | 61.97 | 65.47 | 67.96 |
| Camarilla | 56.82 | 57.37 | 57.92 | 58.47 | 59.02 | 59.57 | 60.12 |
| Woodie | 49.49 | 53.24 | 55.48 | 59.23 | 61.47 | 65.22 | 67.46 |
| Fibonacci | 53.49 | 55.78 | 57.19 | 59.48 | 61.77 | 63.18 | 65.47 |
Numerical data
The following is the status of technical indicators and moving averages registered at the time this technical analysis was created:
| RSI (14): | 68.25 | |
| MACD (12,26,9): | 0.3100 | |
| Directional Movement: | 32.87 | |
| AROON (14): | 71.43 | |
| DEMA (21): | 61.36 | |
| Parabolic SAR (0,02-0,02-0,2): | 60.21 | |
| Elder Ray (13): | 1.03 | |
| Super Trend (3,10): | 60.35 | |
| Zig ZAG (10): | 62.25 | |
| VORTEX (21): | 1.0100 | |
| Stochastique (14,3,5): | 67.62 | |
| TEMA (21): | 61.59 | |
| Williams %R (14): | -43.75 | |
| Chande Momentum Oscillator (20): | 1.55 | |
| Repulse (5,40,3): | 0.4300 | |
| ROCnROLL: | 1 | |
| TRIX (15,9): | 0.0200 | |
| Courbe Coppock: | 2.49 |
| MA7: | 60.73 | |
| MA20: | 60.02 | |
| MA50: | 58.32 | |
| MA100: | 55.99 | |
| MAexp7: | 61.57 | |
| MAexp20: | 61.04 | |
| MAexp50: | 60.66 | |
| MAexp100: | 59.97 | |
| Price / MA7: | +2.50% | |
| Price / MA20: | +3.72% | |
| Price / MA50: | +6.74% | |
| Price / MA100: | +11.18% | |
| Price / MAexp7: | +1.10% | |
| Price / MAexp20: | +1.98% | |
| Price / MAexp50: | +2.62% | |
| Price / MAexp100: | +3.80% |
About author

Online


Add a comment
Comments
0 comments on the analysis COMCAST HOLDINGS ZONES - 1H