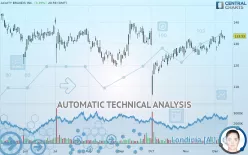
ACUITY BRANDS INC. - Daily - Technical analysis published on 12/11/2019 (GMT)
- 363
- 0
- Who voted?
Click here for a new analysis!
- Timeframe : Daily
- - Analysis generated on
- Status : TARGET REACHED

Summary of the analysis

Additional analysis
Quotes
ACUITY BRANDS INC. rating 133.53 USD. The price has increased by +0.39% since the last closing with the lowest point at 131.79 USD and the highest point at 133.62 USD. The deviation from the price is +1.32% for the low point and -0.07% for the high point.The Central Gaps scanner detects a bearish opening. A small advantage for sellers in the very short term.
Bearish opening
Type : Bearish
Timeframe : Openning
A study of price movements over other periods shows the following variations:
Near a new HIGH record (1 month)
Type : Bullish
Timeframe : Weekly
Technical
Technical analysis of ACUITY BRANDS INC. in Daily shows a strongly overall bullish trend. 82.14% of the signals given by moving averages are bullish. This strongly bullish trend is supported by the strong bullish signals given by short-term moving averages. The Central Indicators market scanner currently does not detect any result that concerns moving averages.
In fact, 16 technical indicators on 18 studied are currently positioned bullish. Caution: the Central Indicators scanner currently detects an excess:
CCI indicator is overbought : over 100
Type : Neutral
Timeframe : Daily
CCI indicator: bearish divergence
Type : Bearish
Timeframe : Daily
RSI indicator: bearish divergence
Type : Bearish
Timeframe : Daily
Williams %R indicator is overbought : over -20
Type : Neutral
Timeframe : Daily
Price is back over the pivot point
Type : Bullish
Timeframe : Weekly
Price is back under the pivot point
Type : Bearish
Timeframe : Daily
The Central Patterns scanner, which studies chart patterns, resistances and supports, has identified this signal:
Near resistance of triangle
Type : Bearish
Timeframe : Daily
The Central Candlesticks scanner which studies Japanese candlesticks did not detect anything.
| S3 | S2 | S1 | Price | R1 | R2 | R3 | |
|---|---|---|---|---|---|---|---|
| ProTrendLines | 123.67 | 128.06 | 131.82 | 133.53 | 135.49 | 139.11 | 144.99 |
| Change (%) | -7.38% | -4.10% | -1.28% | - | +1.47% | +4.18% | +8.58% |
| Change | -9.86 | -5.47 | -1.71 | - | +1.96 | +5.58 | +11.46 |
| Level | Minor | Minor | Intermediate | - | Intermediate | Intermediate | Major |
Pivot points can also be used to set your price objectives. Here is the price situation in relation to pivot points:
| Pivot points | S3 | S2 | S1 | PP | R1 | R2 | R3 |
|---|---|---|---|---|---|---|---|
| Standard | 129.92 | 131.10 | 132.06 | 133.24 | 134.20 | 135.38 | 136.34 |
| Camarilla | 132.42 | 132.62 | 132.81 | 133.01 | 133.21 | 133.40 | 133.60 |
| Woodie | 129.80 | 131.05 | 131.94 | 133.19 | 134.08 | 135.33 | 136.22 |
| Fibonacci | 131.10 | 131.92 | 132.43 | 133.24 | 134.06 | 134.57 | 135.38 |
| Pivot points | S3 | S2 | S1 | PP | R1 | R2 | R3 |
|---|---|---|---|---|---|---|---|
| Standard | 118.86 | 122.81 | 128.31 | 132.26 | 137.76 | 141.71 | 147.21 |
| Camarilla | 131.20 | 132.07 | 132.93 | 133.80 | 134.67 | 135.53 | 136.40 |
| Woodie | 119.63 | 123.20 | 129.08 | 132.65 | 138.53 | 142.10 | 147.98 |
| Fibonacci | 122.81 | 126.42 | 128.65 | 132.26 | 135.87 | 138.10 | 141.71 |
| Pivot points | S3 | S2 | S1 | PP | R1 | R2 | R3 |
|---|---|---|---|---|---|---|---|
| Standard | 117.11 | 120.87 | 125.83 | 129.59 | 134.55 | 138.31 | 143.27 |
| Camarilla | 128.38 | 129.18 | 129.98 | 130.78 | 131.58 | 132.38 | 133.18 |
| Woodie | 117.70 | 121.17 | 126.42 | 129.89 | 135.14 | 138.61 | 143.86 |
| Fibonacci | 120.87 | 124.20 | 126.26 | 129.59 | 132.92 | 134.98 | 138.31 |
Numerical data
The following is the status of technical indicators and moving averages registered at the time this technical analysis was created:
| RSI (14): | 60.25 | |
| MACD (12,26,9): | 1.5700 | |
| Directional Movement: | 8.78 | |
| AROON (14): | 71.42 | |
| DEMA (21): | 132.22 | |
| Parabolic SAR (0,02-0,02-0,2): | 129.43 | |
| Elder Ray (13): | 1.52 | |
| Super Trend (3,10): | 125.20 | |
| Zig ZAG (10): | 133.53 | |
| VORTEX (21): | 1.0700 | |
| Stochastique (14,3,5): | 74.51 | |
| TEMA (21): | 133.20 | |
| Williams %R (14): | -24.72 | |
| Chande Momentum Oscillator (20): | 6.73 | |
| Repulse (5,40,3): | 1.1800 | |
| ROCnROLL: | 1 | |
| TRIX (15,9): | 0.1400 | |
| Courbe Coppock: | 7.40 |
| MA7: | 131.70 | |
| MA20: | 129.60 | |
| MA50: | 126.51 | |
| MA100: | 128.11 | |
| MAexp7: | 132.24 | |
| MAexp20: | 130.32 | |
| MAexp50: | 128.77 | |
| MAexp100: | 128.74 | |
| Price / MA7: | +1.39% | |
| Price / MA20: | +3.03% | |
| Price / MA50: | +5.55% | |
| Price / MA100: | +4.23% | |
| Price / MAexp7: | +0.98% | |
| Price / MAexp20: | +2.46% | |
| Price / MAexp50: | +3.70% | |
| Price / MAexp100: | +3.72% |
News
Don"t forget to follow the news on ACUITY BRANDS INC.. At the time of publication of this analysis, the latest news was as follows:
- Acuity Brands to Announce Fiscal 2020 First Quarter Results On January 9, 2020
- Acuity Brands Introduces the Modulus Low Voltage Distributed Power and Control System
- Acuity Brands Announces Strategic Partnership with CIRCADIAN ZircLight, Inc.
- Acuity Brands Announces Acquisition of LocusLabs, Inc.
- Juno AI™ – a Portfolio of Downlights that Can Do It All – Promises to Simplify Smart Home Automation
About author

Online


Add a comment
Comments
0 comments on the analysis ACUITY BRANDS INC. - Daily