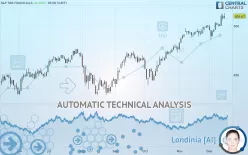
S&P 500 FINANCIALS - Daily - Technical analysis published on 12/17/2019 (GMT)
- 377
- 0
- Who voted?
Click here for a new analysis!
- Timeframe : Daily
- - Analysis generated on
- Status : LEVEL MAINTAINED

Summary of the analysis

Additional analysis
Quotes
The S&P 500 FINANCIALS rating is 509.67 USD. The price registered an increase of +0.40% on the session with the lowest point at 507.63 USD and the highest point at 512.94 USD. The deviation from the price is +0.40% for the low point and -0.64% for the high point.Here is a more detailed summary of the historical variations registered by S&P 500 FINANCIALS:
New HIGH record (5 years)
Type : Bullish
Timeframe : Weekly
New HIGH record (1 year)
Type : Bullish
Timeframe : Weekly
New HIGH record (1st january)
Type : Bullish
Timeframe : Weekly
New HIGH record (1 month)
Type : Bullish
Timeframe : Weekly
Near a new LOW record (1 month)
Type : Bearish
Timeframe : Weekly
Technical
Technical analysis of S&P 500 FINANCIALS in Daily shows a strongly overall bullish trend. 92.86% of the signals given by moving averages are bullish. The overall trend is supported by the strong bullish signals from short-term moving averages. The Central Indicators market scanner currently does not detect any result that concerns moving averages.
In fact, 13 technical indicators on 18 studied are currently bullish. Caution: the Central Indicators scanner currently detects an excess:
CCI indicator is overbought : over 100
Type : Neutral
Timeframe : Daily
Previous candle closed over Bollinger bands
Type : Neutral
Timeframe : Daily
Williams %R indicator is overbought : over -20
Type : Neutral
Timeframe : Daily
Price is back over the pivot point
Type : Bullish
Timeframe : Weekly
Price is back under the pivot point
Type : Bearish
Timeframe : Daily
Central Patterns, the scanner specializing in chart patterns, did not identify any signals.
No result was found by the Central Candlesticks scanner on Japanese candlesticks.
| S3 | S2 | S1 | Price | |
|---|---|---|---|---|
| ProTrendLines | 476.08 | 502.58 | 509.47 | 509.67 |
| Change (%) | -6.59% | -1.39% | -0.04% | - |
| Change | -33.59 | -7.09 | -0.20 | - |
| Level | Minor | Intermediate | Major | - |
To determine price objectives, it is also possible to use the pivot points. Here is the price position in relation to pivot points:
| Pivot points | S3 | S2 | S1 | PP | R1 | R2 | R3 |
|---|---|---|---|---|---|---|---|
| Standard | 497.47 | 501.34 | 504.49 | 508.36 | 511.51 | 515.38 | 518.53 |
| Camarilla | 505.70 | 506.34 | 506.99 | 507.63 | 508.27 | 508.92 | 509.56 |
| Woodie | 497.10 | 501.16 | 504.12 | 508.18 | 511.14 | 515.20 | 518.16 |
| Fibonacci | 501.34 | 504.03 | 505.68 | 508.36 | 511.05 | 512.70 | 515.38 |
| Pivot points | S3 | S2 | S1 | PP | R1 | R2 | R3 |
|---|---|---|---|---|---|---|---|
| Standard | 486.68 | 492.72 | 500.17 | 506.21 | 513.66 | 519.70 | 527.15 |
| Camarilla | 503.92 | 505.16 | 506.39 | 507.63 | 508.87 | 510.10 | 511.34 |
| Woodie | 487.40 | 493.07 | 500.89 | 506.56 | 514.38 | 520.05 | 527.87 |
| Fibonacci | 492.72 | 497.87 | 501.05 | 506.21 | 511.36 | 514.54 | 519.70 |
| Pivot points | S3 | S2 | S1 | PP | R1 | R2 | R3 |
|---|---|---|---|---|---|---|---|
| Standard | 458.38 | 467.19 | 483.07 | 491.88 | 507.76 | 516.57 | 532.45 |
| Camarilla | 492.17 | 494.43 | 496.70 | 498.96 | 501.22 | 503.49 | 505.75 |
| Woodie | 461.93 | 468.96 | 486.62 | 493.65 | 511.31 | 518.34 | 536.00 |
| Fibonacci | 467.19 | 476.62 | 482.45 | 491.88 | 501.31 | 507.14 | 516.57 |
Numerical data
The following is the status of technical indicators and moving averages registered at the time this technical analysis was created:
| RSI (14): | 68.28 | |
| MACD (12,26,9): | 5.8500 | |
| Directional Movement: | 17.58 | |
| AROON (14): | 64.29 | |
| DEMA (21): | 506.62 | |
| Parabolic SAR (0,02-0,02-0,2): | 489.82 | |
| Elder Ray (13): | 8.55 | |
| Super Trend (3,10): | 494.89 | |
| Zig ZAG (10): | 509.67 | |
| VORTEX (21): | 1.1900 | |
| Stochastique (14,3,5): | 88.37 | |
| TEMA (21): | 506.77 | |
| Williams %R (14): | -12.16 | |
| Chande Momentum Oscillator (20): | 9.64 | |
| Repulse (5,40,3): | 0.8200 | |
| ROCnROLL: | 1 | |
| TRIX (15,9): | 0.1600 | |
| Courbe Coppock: | 3.48 |
| MA7: | 504.58 | |
| MA20: | 498.55 | |
| MA50: | 484.65 | |
| MA100: | 469.32 | |
| MAexp7: | 504.86 | |
| MAexp20: | 498.80 | |
| MAexp50: | 487.62 | |
| MAexp100: | 475.67 | |
| Price / MA7: | +1.01% | |
| Price / MA20: | +2.23% | |
| Price / MA50: | +5.16% | |
| Price / MA100: | +8.60% | |
| Price / MAexp7: | +0.95% | |
| Price / MAexp20: | +2.18% | |
| Price / MAexp50: | +4.52% | |
| Price / MAexp100: | +7.15% |
About author

Online


Add a comment
Comments
0 comments on the analysis S&P 500 FINANCIALS - Daily