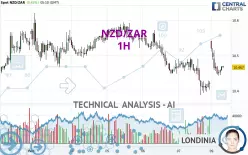
NZD/ZAR - 1H - Technical analysis published on 02/10/2025 (GMT)
- 109
- 0
Click here for a new analysis!
- Timeframe : 1H
- - Analysis generated on
- Status : TARGET REACHED

Summary of the analysis

Additional analysis
Quotes
NZD/ZAR rating 10.4668 ZAR. The price registered an increase of +0.42% on the session and was traded between 10.4431 ZAR and 10.5417 ZAR over the period. The price is currently at +0.23% from its lowest and -0.71% from its highest.The Central Gaps scanner detects the formation of a bullish gap marking the strong presence of buyers against sellers at the opening. This formed a quotation gap.
Opening Gap UP
Type : Bullish
Timeframe : Openning
Here is a more detailed summary of the historical variations registered by NZD/ZAR:
Near a new LOW record (1 year)
Type : Bearish
Timeframe : Weekly
Near a new HIGH record (1st january)
Type : Bullish
Timeframe : Weekly
Near a new HIGH record (1 month)
Type : Bullish
Timeframe : Weekly
Technical
Technical analysis of this 1H chart of NZD/ZAR indicates that the overall trend is bearish. 75.00% of the signals given by moving averages are bearish. Caution: as the signals currently given by short-term moving averages are rather neutral, the bearish trend could slow down. The Central Indicators market scanner is currently detecting a bullish signal that could impact this trend:
Bullish price crossover with adaptative moving average 20
Type : Bullish
Timeframe : 1 hour
The probability of a further increase is slight given the direction of the technical indicators.
Central Indicators, the detector scanner for these technical indicators has recently detected several signals:
RSI indicator is back over 50
Type : Bullish
Timeframe : 1 hour
Price is back under the pivot point
Type : Bearish
Timeframe : Weekly
Williams %R indicator is back over -50
Type : Bullish
Timeframe : 1 hour
An analysis of the price chart with the Central Patterns scanner (detector of chart patterns and resistances and supports) shows a result that can have an impact on the price change:
Near horizontal support
Type : Bullish
Timeframe : 1 hour
The Central Candlesticks scanner, specialised in Japanese candlesticks, did not identify any signals.
| S3 | S2 | S1 | Price | R1 | R2 | R3 | |
|---|---|---|---|---|---|---|---|
| ProTrendLines | 10.2536 | 10.3878 | 10.4329 | 10.4668 | 10.4946 | 10.5448 | 10.5941 |
| Change (%) | -2.04% | -0.75% | -0.32% | - | +0.27% | +0.75% | +1.22% |
| Change | -0.2132 | -0.0790 | -0.0339 | - | +0.0278 | +0.0780 | +0.1273 |
| Level | Intermediate | Minor | Major | - | Intermediate | Minor | Intermediate |
To determine price objectives, it is also possible to use the pivot points. Here is the price position in relation to pivot points:
| Pivot points | S3 | S2 | S1 | PP | R1 | R2 | R3 |
|---|---|---|---|---|---|---|---|
| Standard | 10.2682 | 10.3280 | 10.3753 | 10.4351 | 10.4824 | 10.5422 | 10.5895 |
| Camarilla | 10.3932 | 10.4030 | 10.4128 | 10.4226 | 10.4324 | 10.4422 | 10.4521 |
| Woodie | 10.2620 | 10.3249 | 10.3691 | 10.4320 | 10.4762 | 10.5391 | 10.5833 |
| Fibonacci | 10.3280 | 10.3689 | 10.3942 | 10.4351 | 10.4760 | 10.5013 | 10.5422 |
| Pivot points | S3 | S2 | S1 | PP | R1 | R2 | R3 |
|---|---|---|---|---|---|---|---|
| Standard | 10.1010 | 10.2444 | 10.3335 | 10.4769 | 10.5660 | 10.7094 | 10.7985 |
| Camarilla | 10.3587 | 10.3800 | 10.4013 | 10.4226 | 10.4439 | 10.4652 | 10.4865 |
| Woodie | 10.0739 | 10.2308 | 10.3064 | 10.4633 | 10.5389 | 10.6958 | 10.7714 |
| Fibonacci | 10.2444 | 10.3332 | 10.3881 | 10.4769 | 10.5657 | 10.6206 | 10.7094 |
| Pivot points | S3 | S2 | S1 | PP | R1 | R2 | R3 |
|---|---|---|---|---|---|---|---|
| Standard | 10.1439 | 10.2818 | 10.4063 | 10.5442 | 10.6687 | 10.8066 | 10.9311 |
| Camarilla | 10.4585 | 10.4826 | 10.5067 | 10.5307 | 10.5548 | 10.5788 | 10.6029 |
| Woodie | 10.1371 | 10.2785 | 10.3995 | 10.5409 | 10.6619 | 10.8033 | 10.9243 |
| Fibonacci | 10.2818 | 10.3821 | 10.4440 | 10.5442 | 10.6445 | 10.7064 | 10.8066 |
Numerical data
The following are the details of the technical indicators and moving averages that were collected to generate this technical analysis:
| RSI (14): | 51.55 | |
| MACD (12,26,9): | -0.0024 | |
| Directional Movement: | 1.8498 | |
| AROON (14): | 50.0000 | |
| DEMA (21): | 10.4502 | |
| Parabolic SAR (0,02-0,02-0,2): | 10.4081 | |
| Elder Ray (13): | 0.0053 | |
| Super Trend (3,10): | 10.4230 | |
| Zig ZAG (10): | 10.4627 | |
| VORTEX (21): | 0.8589 | |
| Stochastique (14,3,5): | 44.68 | |
| TEMA (21): | 10.4594 | |
| Williams %R (14): | -54.00 | |
| Chande Momentum Oscillator (20): | 0.0487 | |
| Repulse (5,40,3): | -0.0374 | |
| ROCnROLL: | -1 | |
| TRIX (15,9): | -0.0099 | |
| Courbe Coppock: | 0.48 |
| MA7: | 10.5032 | |
| MA20: | 10.5205 | |
| MA50: | 10.5058 | |
| MA100: | 10.5905 | |
| MAexp7: | 10.4589 | |
| MAexp20: | 10.4566 | |
| MAexp50: | 10.4737 | |
| MAexp100: | 10.4948 | |
| Price / MA7: | -0.35% | |
| Price / MA20: | -0.51% | |
| Price / MA50: | -0.37% | |
| Price / MA100: | -1.17% | |
| Price / MAexp7: | +0.08% | |
| Price / MAexp20: | +0.10% | |
| Price / MAexp50: | -0.07% | |
| Price / MAexp100: | -0.27% |
About author
Online


Add a comment
Comments
0 comments on the analysis NZD/ZAR - 1H