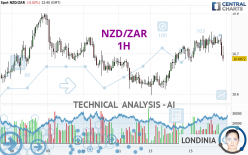
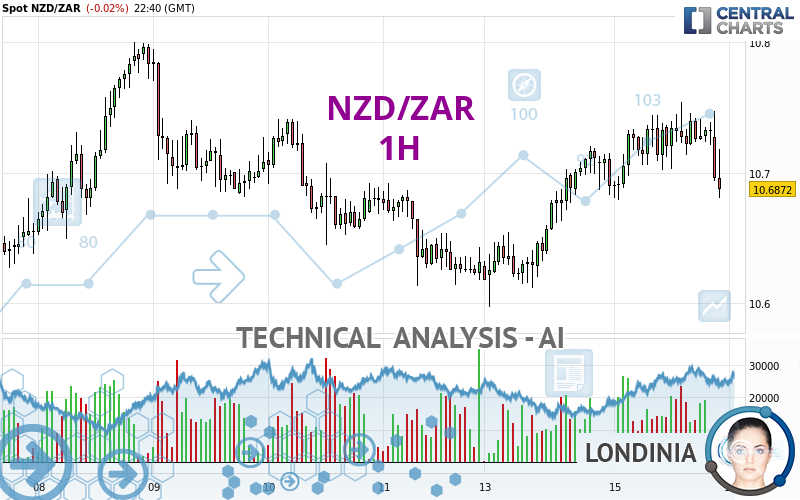
NZD/ZAR - 1H - Technical analysis published on 10/15/2024 (GMT)
- 64
- 0
- Timeframe : 1H
- - Analysis generated on
- Status : IN PROGRESS...
Summary of the analysis

Additional analysis
Quotes
The NZD/ZAR price is 10.6872 ZAR. On the day, this instrument lost -0.02% with the lowest point at 10.6788 ZAR and the highest point at 10.7543 ZAR. The deviation from the price is +0.08% for the low point and -0.62% for the high point.A bullish opening was detected by the Central Gaps scanner. Buyers are trying to impose a bullish momentum in the very short term.
Bullish opening
Type : Bullish
Timeframe : Openning
A study of price movements over other periods shows the following variations:
Near a new LOW record (1 year)
Type : Bearish
Timeframe : Weekly
Near a new LOW record (1st january)
Type : Bearish
Timeframe : Weekly
Near a new HIGH record (1 month)
Type : Bullish
Timeframe : Weekly
Technical
Technical analysis of NZD/ZAR in 1H shows an overall bullish trend. The signals given by moving averages are 67.86% bullish. This bullish trend could slow down given the slightly bearish signals currently being given by short-term moving averages. An assessment of moving averages reveals several bearish signals that could impact this trend:
Bearish trend reversal : adaptative moving average 20
Type : Bearish
Timeframe : 1 hour
Bearish trend reversal : adaptative moving average 50
Type : Bearish
Timeframe : 1 hour
Bearish trend reversal : adaptative moving average 100
Type : Bearish
Timeframe : 1 hour
Bearish price crossover with adaptative moving average 50
Type : Bearish
Timeframe : 1 hour
Bearish price crossover with adaptative moving average 100
Type : Bearish
Timeframe : 1 hour
In fact, Central Analyzer took into account 18 technical indicators and the result was as follows: 5 are bullish, 10 are neutral and 3 are bearish. But beware of excesses. The Central Indicators scanner currently detects this:
CCI indicator is oversold : under -100
Type : Neutral
Timeframe : 1 hour
Previous candle closed under Bollinger bands
Type : Neutral
Timeframe : 1 hour
Price is back over the pivot point
Type : Bullish
Timeframe : Weekly
The Central Patterns scanner, which studies chart patterns, resistances and supports, has identified these signals:
Near horizontal resistance
Type : Bearish
Timeframe : 1 hour
Resistance of channel is broken
Type : Bullish
Timeframe : 1 hour
Central Candlesticks, the scanner specialised in Japanese candlesticks, detects a bullish signal that could support the hypothesis of a small rebound in the very short term:
Bullish harami
Type : Bullish
Timeframe : 1 hour
| S3 | S2 | S1 | Price | R1 | R2 | R3 | |
|---|---|---|---|---|---|---|---|
| ProTrendLines | 10.6128 | 10.6540 | 10.6810 | 10.6872 | 10.7411 | 10.8004 | 10.8359 |
| Change (%) | -0.70% | -0.31% | -0.06% | - | +0.50% | +1.06% | +1.39% |
| Change | -0.0744 | -0.0332 | -0.0062 | - | +0.0539 | +0.1132 | +0.1487 |
| Level | Major | Minor | Minor | - | Intermediate | Major | Major |
Attention could also be paid to pivot points to set price objectives:
| Pivot points | S3 | S2 | S1 | PP | R1 | R2 | R3 |
|---|---|---|---|---|---|---|---|
| Standard | 10.4941 | 10.5456 | 10.6177 | 10.6692 | 10.7413 | 10.7928 | 10.8649 |
| Camarilla | 10.6557 | 10.6670 | 10.6784 | 10.6897 | 10.7010 | 10.7124 | 10.7237 |
| Woodie | 10.5043 | 10.5508 | 10.6279 | 10.6744 | 10.7515 | 10.7980 | 10.8751 |
| Fibonacci | 10.5456 | 10.5929 | 10.6220 | 10.6692 | 10.7165 | 10.7456 | 10.7928 |
| Pivot points | S3 | S2 | S1 | PP | R1 | R2 | R3 |
|---|---|---|---|---|---|---|---|
| Standard | 10.3744 | 10.4938 | 10.5626 | 10.6820 | 10.7508 | 10.8702 | 10.9390 |
| Camarilla | 10.5797 | 10.5969 | 10.6142 | 10.6314 | 10.6487 | 10.6659 | 10.6832 |
| Woodie | 10.3491 | 10.4812 | 10.5373 | 10.6694 | 10.7255 | 10.8576 | 10.9137 |
| Fibonacci | 10.4938 | 10.5657 | 10.6101 | 10.6820 | 10.7539 | 10.7983 | 10.8702 |
| Pivot points | S3 | S2 | S1 | PP | R1 | R2 | R3 |
|---|---|---|---|---|---|---|---|
| Standard | 10.3647 | 10.5647 | 10.7675 | 10.9675 | 11.1703 | 11.3703 | 11.5731 |
| Camarilla | 10.8595 | 10.8965 | 10.9334 | 10.9703 | 11.0072 | 11.0442 | 11.0811 |
| Woodie | 10.3661 | 10.5654 | 10.7689 | 10.9682 | 11.1717 | 11.3710 | 11.5745 |
| Fibonacci | 10.5647 | 10.7186 | 10.8136 | 10.9675 | 11.1214 | 11.2164 | 11.3703 |
Numerical data
The following is the status of technical indicators and moving averages registered at the time this technical analysis was created:
| RSI (14): | 53.52 | |
| MACD (12,26,9): | 0.0104 | |
| Directional Movement: | 7.4893 | |
| AROON (14): | 28.5714 | |
| DEMA (21): | 10.7383 | |
| Parabolic SAR (0,02-0,02-0,2): | 10.7154 | |
| Elder Ray (13): | 0.0019 | |
| Super Trend (3,10): | 10.6641 | |
| Zig ZAG (10): | 10.7432 | |
| VORTEX (21): | 1.0704 | |
| Stochastique (14,3,5): | 64.43 | |
| TEMA (21): | 10.7377 | |
| Williams %R (14): | -35.44 | |
| Chande Momentum Oscillator (20): | 0.0116 | |
| Repulse (5,40,3): | -0.0190 | |
| ROCnROLL: | -1 | |
| TRIX (15,9): | 0.0174 | |
| Courbe Coppock: | 0.17 |
| MA7: | 10.6955 | |
| MA20: | 10.8177 | |
| MA50: | 10.9238 | |
| MA100: | 11.0321 | |
| MAexp7: | 10.7273 | |
| MAexp20: | 10.7224 | |
| MAexp50: | 10.7028 | |
| MAexp100: | 10.7001 | |
| Price / MA7: | -0.08% | |
| Price / MA20: | -1.21% | |
| Price / MA50: | -2.17% | |
| Price / MA100: | -3.13% | |
| Price / MAexp7: | -0.37% | |
| Price / MAexp20: | -0.33% | |
| Price / MAexp50: | -0.15% | |
| Price / MAexp100: | -0.12% |
About author
Online


Add a comment
Comments
0 comments on the analysis NZD/ZAR - 1H