| Open: | 3.32 |
| Change: | -0.25 |
| Volume: | 510,282 |
| Low: | 3.07 |
| High: | 3.35 |
| High / Low range: | 0.28 |
| Type: | Forex |
| Ticker: | NZDZAR |
| ISIN: |
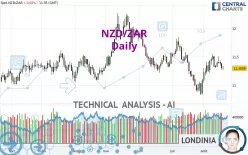
NZD/ZAR - Daily - Technical analysis published on 08/18/2023 (GMT)
- 192
- 0
- 08/18/2023 - 11:35
Click here for a new analysis!
- Timeframe : Daily
- - Analysis generated on 08/18/2023 - 11:35
- Status : TARGET REACHED

Summary of the analysis

Additional analysis
Quotes
The NZD/ZAR price is 11.3005 ZAR. The price registered a decrease of -0.02% on the session and was traded between 11.2690 ZAR and 11.3391 ZAR over the period. The price is currently at +0.28% from its lowest and -0.34% from its highest.The Central Gaps scanner detects a bullish opening marking the presence of buyers ahead of sellers at the opening but not sufficiently marked to allow the price to register a quotation gap.
Bullish opening
Type : Bullish
Timeframe : Openning
A study of price movements over other periods shows the following variations:
Near a new LOW record (1 month)
Type : Bearish
Timeframe : Weekly
Technical
A technical analysis in Daily of this NZD/ZAR chart shows a bearish trend. 71.43% of the signals given by moving averages are bearish. Caution: the neutral signals currently given by short-term moving averages show us that the global trend is losing momentum. The Central Indicators market scanner is currently detecting several bearish signals that could impact this trend:
Bearish trend reversal : adaptative moving average 20
Type : Bearish
Timeframe : Daily
Bearish trend reversal : adaptative moving average 50
Type : Bearish
Timeframe : Daily
Bearish trend reversal : adaptative moving average 100
Type : Bearish
Timeframe : Daily
In fact, according to the parameters integrated into the Central Analyzer system, only 7 technical indicators out of 18 analysed are currently bullish. No additional result has been identified by Central Indicators, the scanner specialised in technical indicators.
The Central Patterns scanner, which studies chart patterns, resistances and supports, has identified this signal:
Near resistance of triangle
Type : Bearish
Timeframe : Daily
There is also a Japanese candlestick pattern detected by Central Candlesticks that could mark the end of the current short-term trend:
Doji
Type : Neutral
Timeframe : Daily
| S3 | S2 | S1 | Price | R1 | R2 | R3 | |
|---|---|---|---|---|---|---|---|
| ProTrendLines | 10.8491 | 11.0759 | 11.2489 | 11.3005 | 11.3867 | 11.6735 | 12.2059 |
| Change (%) | -3.99% | -1.99% | -0.46% | - | +0.76% | +3.30% | +8.01% |
| Change | -0.4514 | -0.2246 | -0.0516 | - | +0.0862 | +0.3730 | +0.9054 |
| Level | Minor | Major | Major | - | Minor | Major | Major |
Attention could also be paid to pivot points to set price objectives:
| Pivot points | S3 | S2 | S1 | PP | R1 | R2 | R3 |
|---|---|---|---|---|---|---|---|
| Standard | 11.1258 | 11.1977 | 11.2502 | 11.3221 | 11.3746 | 11.4465 | 11.4990 |
| Camarilla | 11.2686 | 11.2800 | 11.2914 | 11.3028 | 11.3142 | 11.3256 | 11.3370 |
| Woodie | 11.1162 | 11.1929 | 11.2406 | 11.3173 | 11.3650 | 11.4417 | 11.4894 |
| Fibonacci | 11.1977 | 11.2452 | 11.2746 | 11.3221 | 11.3696 | 11.3990 | 11.4465 |
| Pivot points | S3 | S2 | S1 | PP | R1 | R2 | R3 |
|---|---|---|---|---|---|---|---|
| Standard | 10.8552 | 11.0366 | 11.1907 | 11.3721 | 11.5262 | 11.7076 | 11.8617 |
| Camarilla | 11.2525 | 11.2833 | 11.3141 | 11.3448 | 11.3756 | 11.4063 | 11.4371 |
| Woodie | 10.8416 | 11.0298 | 11.1771 | 11.3653 | 11.5126 | 11.7008 | 11.8481 |
| Fibonacci | 11.0366 | 11.1648 | 11.2439 | 11.3721 | 11.5003 | 11.5794 | 11.7076 |
| Pivot points | S3 | S2 | S1 | PP | R1 | R2 | R3 |
|---|---|---|---|---|---|---|---|
| Standard | 9.6377 | 10.2305 | 10.6582 | 11.2510 | 11.6787 | 12.2715 | 12.6992 |
| Camarilla | 10.8053 | 10.8988 | 10.9924 | 11.0859 | 11.1795 | 11.2730 | 11.3665 |
| Woodie | 9.5552 | 10.1892 | 10.5757 | 11.2097 | 11.5962 | 12.2302 | 12.6167 |
| Fibonacci | 10.2305 | 10.6203 | 10.8612 | 11.2510 | 11.6408 | 11.8817 | 12.2715 |
Numerical data
The following is the status of technical indicators and moving averages registered at the time this technical analysis was created:
| RSI (14): | 48.57 | |
| MACD (12,26,9): | 0.0070 | |
| Directional Movement: | 1.0595 | |
| AROON (14): | 50.0000 | |
| DEMA (21): | 11.3150 | |
| Parabolic SAR (0,02-0,02-0,2): | 11.5478 | |
| Elder Ray (13): | -0.0245 | |
| Super Trend (3,10): | 10.9964 | |
| Zig ZAG (10): | 11.3048 | |
| VORTEX (21): | 1.0398 | |
| Stochastique (14,3,5): | 64.09 | |
| TEMA (21): | 11.3700 | |
| Williams %R (14): | -49.25 | |
| Chande Momentum Oscillator (20): | 0.0619 | |
| Repulse (5,40,3): | -0.6798 | |
| ROCnROLL: | 2 | |
| TRIX (15,9): | -0.0144 | |
| Courbe Coppock: | 5.43 |
| MA7: | 11.3517 | |
| MA20: | 11.2369 | |
| MA50: | 11.3523 | |
| MA100: | 11.4746 | |
| MAexp7: | 11.3426 | |
| MAexp20: | 11.3200 | |
| MAexp50: | 11.3658 | |
| MAexp100: | 11.3711 | |
| Price / MA7: | -0.45% | |
| Price / MA20: | +0.57% | |
| Price / MA50: | -0.46% | |
| Price / MA100: | -1.52% | |
| Price / MAexp7: | -0.37% | |
| Price / MAexp20: | -0.17% | |
| Price / MAexp50: | -0.57% | |
| Price / MAexp100: | -0.62% |
About author
Online


Add a comment
Comments
0 comments on the analysis NZD/ZAR - Daily