| Open: | - |
| Change: | - |
| Volume: | - |
| Low: | - |
| High: | - |
| High / Low range: | - |
| Type: | Forex |
| Ticker: | NZDZAR |
| ISIN: |
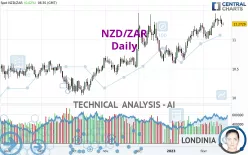
NZD/ZAR - Daily - Technical analysis published on 02/20/2023 (GMT)
- 137
- 0
- 02/20/2023 - 06:35
Click here for a new analysis!
- Timeframe : Daily
- - Analysis generated on 02/20/2023 - 06:35
- Status : TARGET REACHED

Summary of the analysis

Additional analysis
Quotes
The NZD/ZAR rating is 11.2709 ZAR. The price registered an increase of +0.00% on the session and was traded between 11.2468 ZAR and 11.2959 ZAR over the period. The price is currently at +0.21% from its lowest and -0.22% from its highest.The Central Gaps scanner detects a bearish opening marking the presence of sellers ahead of buyers at the opening but not sufficiently marked to allow the price to register a quotation gap.
Bearish opening
Type : Bearish
Timeframe : Openning
A study of price movements over other periods shows the following variations:
Near a new HIGH record (5 years)
Type : Bullish
Timeframe : Weekly
Near a new HIGH record (1 year)
Type : Bullish
Timeframe : Weekly
Near a new HIGH record (1st january)
Type : Bullish
Timeframe : Weekly
Near a new LOW record (1 month)
Type : Bearish
Timeframe : Weekly
Technical
Technical analysis of NZD/ZAR in Daily shows a strongly overall bullish trend. 92.86% of the signals given by moving averages are bullish. The overall trend is supported by the strong bullish signals from short-term moving averages. The Central Indicators market scanner currently does not detect any result that concerns moving averages.
The probability of a further increase are moderate given the direction of the technical indicators.
The Central Indicators scanner found this result concerning these indicators:
MACD crosses DOWN its Moving Average
Type : Bearish
Timeframe : Daily
The Central Patterns scanner, which studies chart patterns, resistances and supports, has identified this signal:
Near horizontal support
Type : Bullish
Timeframe : Daily
No result was found by the Central Candlesticks scanner on Japanese candlesticks.
| S3 | S2 | S1 | Price | R1 | R2 | |
|---|---|---|---|---|---|---|
| ProTrendLines | 10.6714 | 11.0759 | 11.2512 | 11.2709 | 11.4765 | 11.6735 |
| Change (%) | -5.32% | -1.73% | -0.17% | - | +1.82% | +3.57% |
| Change | -0.5995 | -0.1950 | -0.0197 | - | +0.2056 | +0.4026 |
| Level | Intermediate | Major | Intermediate | - | Intermediate | Major |
To determine price objectives, it is also possible to use the pivot points. Here is the price position in relation to pivot points:
| Pivot points | S3 | S2 | S1 | PP | R1 | R2 | R3 |
|---|---|---|---|---|---|---|---|
| Standard | 11.0555 | 11.1357 | 11.2034 | 11.2836 | 11.3513 | 11.4315 | 11.4992 |
| Camarilla | 11.2305 | 11.2441 | 11.2576 | 11.2712 | 11.2848 | 11.2983 | 11.3119 |
| Woodie | 11.0494 | 11.1326 | 11.1973 | 11.2805 | 11.3452 | 11.4284 | 11.4931 |
| Fibonacci | 11.1357 | 11.1922 | 11.2271 | 11.2836 | 11.3401 | 11.3750 | 11.4315 |
| Pivot points | S3 | S2 | S1 | PP | R1 | R2 | R3 |
|---|---|---|---|---|---|---|---|
| Standard | 10.9362 | 11.0760 | 11.1736 | 11.3134 | 11.4110 | 11.5508 | 11.6484 |
| Camarilla | 11.2059 | 11.2277 | 11.2494 | 11.2712 | 11.2930 | 11.3147 | 11.3365 |
| Woodie | 10.9151 | 11.0655 | 11.1525 | 11.3029 | 11.3899 | 11.5403 | 11.6273 |
| Fibonacci | 11.0760 | 11.1667 | 11.2227 | 11.3134 | 11.4041 | 11.4601 | 11.5508 |
| Pivot points | S3 | S2 | S1 | PP | R1 | R2 | R3 |
|---|---|---|---|---|---|---|---|
| Standard | 10.0549 | 10.3166 | 10.7641 | 11.0258 | 11.4733 | 11.7350 | 12.1825 |
| Camarilla | 11.0166 | 11.0816 | 11.1466 | 11.2116 | 11.2766 | 11.3416 | 11.4066 |
| Woodie | 10.1478 | 10.3631 | 10.8570 | 11.0723 | 11.5662 | 11.7815 | 12.2754 |
| Fibonacci | 10.3166 | 10.5875 | 10.7549 | 11.0258 | 11.2967 | 11.4641 | 11.7350 |
Numerical data
The following is the status of the technical indicators and moving averages at the time of publication of this technical analysis:
| RSI (14): | 58.66 | |
| MACD (12,26,9): | 0.0920 | |
| Directional Movement: | 9.4875 | |
| AROON (14): | 42.8571 | |
| DEMA (21): | 11.3187 | |
| Parabolic SAR (0,02-0,02-0,2): | 11.1823 | |
| Elder Ray (13): | 0.0275 | |
| Super Trend (3,10): | 10.9494 | |
| Zig ZAG (10): | 11.2669 | |
| VORTEX (21): | 1.0914 | |
| Stochastique (14,3,5): | 63.80 | |
| TEMA (21): | 11.3399 | |
| Williams %R (14): | -41.83 | |
| Chande Momentum Oscillator (20): | 0.2070 | |
| Repulse (5,40,3): | -0.2721 | |
| ROCnROLL: | 1 | |
| TRIX (15,9): | 0.1230 | |
| Courbe Coppock: | 2.68 |
| MA7: | 11.3126 | |
| MA20: | 11.2052 | |
| MA50: | 11.0081 | |
| MA100: | 10.7874 | |
| MAexp7: | 11.2818 | |
| MAexp20: | 11.1964 | |
| MAexp50: | 11.0380 | |
| MAexp100: | 10.8604 | |
| Price / MA7: | -0.37% | |
| Price / MA20: | +0.59% | |
| Price / MA50: | +2.39% | |
| Price / MA100: | +4.48% | |
| Price / MAexp7: | -0.10% | |
| Price / MAexp20: | +0.67% | |
| Price / MAexp50: | +2.11% | |
| Price / MAexp100: | +3.78% |
About author
Online


Add a comment
Comments
0 comments on the analysis NZD/ZAR - Daily