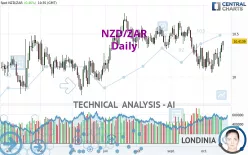
NZD/ZAR - Daily - Technical analysis published on 10/20/2022 (GMT)
- 170
- 0
Click here for a new analysis!
- Timeframe : Daily
- - Analysis generated on
- Status : TARGET REACHED

Summary of the analysis

Additional analysis
Quotes
NZD/ZAR rating 10.4136 ZAR. The price has increased by +0.45% since the last closing with the lowest point at 10.3146 ZAR and the highest point at 10.4192 ZAR. The deviation from the price is +0.96% for the low point and -0.05% for the high point.The Central Gaps scanner detects a bullish opening marking the presence of buyers ahead of sellers at the opening but not sufficiently marked to allow the price to register a quotation gap.
Bullish opening
Type : Bullish
Timeframe : Openning
A study of price movements over other periods shows the following variations:
Near a new LOW record (1 month)
Type : Bearish
Timeframe : Weekly
Technical
Technical analysis of this Daily chart of NZD/ZAR indicates that the overall trend is bullish. 67.86% of the signals given by moving averages are bullish. This bullish trend is supported by the strong bullish signals given by short-term moving averages. The Central Indicators scanner detects bullish signals on moving averages that could impact this trend:
Bullish trend reversal : Moving Average 20
Type : Bullish
Timeframe : Daily
Bullish trend reversal : adaptative moving average 50
Type : Bullish
Timeframe : Daily
Bullish trend reversal : adaptative moving average 100
Type : Bullish
Timeframe : Daily
Bullish price crossover with Moving Average 50
Type : Bullish
Timeframe : Daily
In fact, 14 technical indicators on 18 studied are currently positioned bullish. Caution: the Central Indicators scanner currently detects an excess:
CCI indicator is overbought : over 100
Type : Neutral
Timeframe : Daily
Williams %R indicator is overbought : over -20
Type : Neutral
Timeframe : Daily
Pivot points : price is over resistance 1
Type : Neutral
Timeframe : Daily
Pivot points : price is over resistance 1
Type : Neutral
Timeframe : Weekly
Central Patterns, the market scanner focusing on chart patterns, resistances and supports found this result:
Near resistance of channel
Type : Bearish
Timeframe : Daily
The Central Candlesticks scanner which studies Japanese candlesticks did not detect anything.
| S3 | S2 | S1 | Price | R1 | R2 | R3 | |
|---|---|---|---|---|---|---|---|
| ProTrendLines | 10.0897 | 10.2872 | 10.3512 | 10.4136 | 10.4270 | 10.5030 | 10.6676 |
| Change (%) | -3.11% | -1.21% | -0.60% | - | +0.13% | +0.86% | +2.44% |
| Change | -0.3239 | -0.1264 | -0.0624 | - | +0.0134 | +0.0894 | +0.2540 |
| Level | Minor | Intermediate | Major | - | Minor | Minor | Intermediate |
To determine price objectives, it is also possible to use the pivot points. Here is the price position in relation to pivot points:
| Pivot points | S3 | S2 | S1 | PP | R1 | R2 | R3 |
|---|---|---|---|---|---|---|---|
| Standard | 10.1927 | 10.2388 | 10.3026 | 10.3487 | 10.4125 | 10.4586 | 10.5224 |
| Camarilla | 10.3363 | 10.3464 | 10.3564 | 10.3665 | 10.3766 | 10.3867 | 10.3967 |
| Woodie | 10.2017 | 10.2432 | 10.3116 | 10.3531 | 10.4215 | 10.4630 | 10.5314 |
| Fibonacci | 10.2388 | 10.2808 | 10.3067 | 10.3487 | 10.3907 | 10.4166 | 10.4586 |
| Pivot points | S3 | S2 | S1 | PP | R1 | R2 | R3 |
|---|---|---|---|---|---|---|---|
| Standard | 9.7678 | 9.9059 | 10.0597 | 10.1978 | 10.3516 | 10.4897 | 10.6435 |
| Camarilla | 10.1331 | 10.1599 | 10.1866 | 10.2134 | 10.2402 | 10.2669 | 10.2937 |
| Woodie | 9.7756 | 9.9098 | 10.0675 | 10.2017 | 10.3594 | 10.4936 | 10.6513 |
| Fibonacci | 9.9059 | 10.0174 | 10.0863 | 10.1978 | 10.3093 | 10.3782 | 10.4897 |
| Pivot points | S3 | S2 | S1 | PP | R1 | R2 | R3 |
|---|---|---|---|---|---|---|---|
| Standard | 9.3779 | 9.7363 | 9.9308 | 10.2892 | 10.4837 | 10.8421 | 11.0366 |
| Camarilla | 9.9733 | 10.0239 | 10.0746 | 10.1253 | 10.1760 | 10.2267 | 10.2774 |
| Woodie | 9.2960 | 9.6953 | 9.8489 | 10.2482 | 10.4018 | 10.8011 | 10.9547 |
| Fibonacci | 9.7363 | 9.9475 | 10.0780 | 10.2892 | 10.5004 | 10.6309 | 10.8421 |
Numerical data
The following is the status of technical indicators and moving averages registered at the time this technical analysis was created:
| RSI (14): | 56.72 | |
| MACD (12,26,9): | -0.0149 | |
| Directional Movement: | 4.7070 | |
| AROON (14): | 57.1429 | |
| DEMA (21): | 10.2446 | |
| Parabolic SAR (0,02-0,02-0,2): | 10.1013 | |
| Elder Ray (13): | 0.0914 | |
| Super Trend (3,10): | 10.5524 | |
| Zig ZAG (10): | 10.4138 | |
| VORTEX (21): | 0.9954 | |
| Stochastique (14,3,5): | 89.88 | |
| TEMA (21): | 10.2689 | |
| Williams %R (14): | -0.93 | |
| Chande Momentum Oscillator (20): | 0.2992 | |
| Repulse (5,40,3): | 2.2807 | |
| ROCnROLL: | 1 | |
| TRIX (15,9): | -0.0739 | |
| Courbe Coppock: | 1.17 |
| MA7: | 10.2921 | |
| MA20: | 10.2284 | |
| MA50: | 10.3745 | |
| MA100: | 10.3287 | |
| MAexp7: | 10.3034 | |
| MAexp20: | 10.2801 | |
| MAexp50: | 10.3258 | |
| MAexp100: | 10.3372 | |
| Price / MA7: | +1.18% | |
| Price / MA20: | +1.81% | |
| Price / MA50: | +0.38% | |
| Price / MA100: | +0.82% | |
| Price / MAexp7: | +1.07% | |
| Price / MAexp20: | +1.30% | |
| Price / MAexp50: | +0.85% | |
| Price / MAexp100: | +0.74% |
About author
Online


Add a comment
Comments
0 comments on the analysis NZD/ZAR - Daily