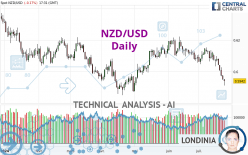
NZD/USD - Daily - Technical analysis published on 07/24/2024 (GMT)
- 226
- 0
Click here for a new analysis!
- Timeframe : Daily
- - Analysis generated on
- Status : INVALID

Summary of the analysis

Additional analysis
Quotes
The NZD/USD rating is 0.5942 USD. On the day, this instrument lost -0.17% and was between 0.5913 USD and 0.5953 USD. This implies that the price is at +0.49% from its lowest and at -0.18% from its highest.Here is a more detailed summary of the historical variations registered by NZD/USD:
Near a new LOW record (1 year)
Type : Bearish
Timeframe : Weekly
Near a new LOW record (1st january)
Type : Bearish
Timeframe : Weekly
Near a new HIGH record (1 month)
Type : Bullish
Timeframe : Weekly
New LOW record (1 month)
Type : Bearish
Timeframe : Weekly
Technical
Technical analysis of NZD/USD in Daily shows a overall strongly bearish trend. 82.14% of the signals given by moving averages are bearish. The overall trend is supported by the strong bearish signals from short-term moving averages. There is no crossing of moving average by the price or crossing of moving averages between themselves.
An assessment of technical indicators shows a bearish signal.
But beware of excesses. The Central Indicators scanner currently detects this:
RSI indicator is oversold : under 30
Type : Neutral
Timeframe : Daily
CCI indicator is oversold : under -100
Type : Neutral
Timeframe : Daily
Previous candle closed under Bollinger bands
Type : Neutral
Timeframe : Daily
Williams %R indicator is oversold : under -80
Type : Neutral
Timeframe : Daily
Pivot points : price is under support 1
Type : Neutral
Timeframe : Weekly
Central Patterns, the market scanner focusing on chart patterns, resistances and supports found these results:
Near horizontal support
Type : Bullish
Timeframe : Daily
Support of channel is broken
Type : Bearish
Timeframe : Daily
There is also a Japanese candlestick pattern detected by Central Candlesticks that could mark the end of the current short-term trend:
Black hanging man / hammer
Type : Neutral
Timeframe : Daily
| S3 | S2 | S1 | Price | R1 | R2 | R3 | |
|---|---|---|---|---|---|---|---|
| ProTrendLines | 0.5562 | 0.5792 | 0.5878 | 0.5942 | 0.5993 | 0.6064 | 0.6106 |
| Change (%) | -6.40% | -2.52% | -1.08% | - | +0.86% | +2.05% | +2.76% |
| Change | -0.0380 | -0.0150 | -0.0064 | - | +0.0051 | +0.0122 | +0.0164 |
| Level | Minor | Major | Major | - | Intermediate | Intermediate | Intermediate |
To determine price objectives, it is also possible to use the pivot points. Here is the price position in relation to pivot points:
| Pivot points | S3 | S2 | S1 | PP | R1 | R2 | R3 |
|---|---|---|---|---|---|---|---|
| Standard | 0.5911 | 0.5931 | 0.5941 | 0.5961 | 0.5971 | 0.5991 | 0.6001 |
| Camarilla | 0.5944 | 0.5947 | 0.5949 | 0.5952 | 0.5955 | 0.5958 | 0.5960 |
| Woodie | 0.5907 | 0.5929 | 0.5937 | 0.5959 | 0.5967 | 0.5989 | 0.5997 |
| Fibonacci | 0.5931 | 0.5942 | 0.5949 | 0.5961 | 0.5972 | 0.5979 | 0.5991 |
| Pivot points | S3 | S2 | S1 | PP | R1 | R2 | R3 |
|---|---|---|---|---|---|---|---|
| Standard | 0.5864 | 0.5935 | 0.5972 | 0.6043 | 0.6080 | 0.6151 | 0.6188 |
| Camarilla | 0.5980 | 0.5990 | 0.6000 | 0.6010 | 0.6020 | 0.6030 | 0.6040 |
| Woodie | 0.5848 | 0.5927 | 0.5956 | 0.6035 | 0.6064 | 0.6143 | 0.6172 |
| Fibonacci | 0.5935 | 0.5976 | 0.6001 | 0.6043 | 0.6084 | 0.6109 | 0.6151 |
| Pivot points | S3 | S2 | S1 | PP | R1 | R2 | R3 |
|---|---|---|---|---|---|---|---|
| Standard | 0.5860 | 0.5958 | 0.6025 | 0.6123 | 0.6190 | 0.6288 | 0.6355 |
| Camarilla | 0.6046 | 0.6061 | 0.6076 | 0.6091 | 0.6106 | 0.6121 | 0.6136 |
| Woodie | 0.5844 | 0.5950 | 0.6009 | 0.6115 | 0.6174 | 0.6280 | 0.6339 |
| Fibonacci | 0.5958 | 0.6021 | 0.6060 | 0.6123 | 0.6186 | 0.6225 | 0.6288 |
Numerical data
The following are the details of the technical indicators and moving averages that were collected to generate this technical analysis:
| RSI (14): | 27.63 | |
| MACD (12,26,9): | -0.0036 | |
| Directional Movement: | -26.8203 | |
| AROON (14): | -85.7143 | |
| DEMA (21): | 0.6016 | |
| Parabolic SAR (0,02-0,02-0,2): | 0.6117 | |
| Elder Ray (13): | -0.0100 | |
| Super Trend (3,10): | 0.6058 | |
| Zig ZAG (10): | 0.5945 | |
| VORTEX (21): | 0.7757 | |
| Stochastique (14,3,5): | 5.49 | |
| TEMA (21): | 0.5981 | |
| Williams %R (14): | -87.14 | |
| Chande Momentum Oscillator (20): | -0.0186 | |
| Repulse (5,40,3): | -0.9464 | |
| ROCnROLL: | 2 | |
| TRIX (15,9): | -0.0436 | |
| Courbe Coppock: | 3.16 |
| MA7: | 0.6011 | |
| MA20: | 0.6070 | |
| MA50: | 0.6108 | |
| MA100: | 0.6058 | |
| MAexp7: | 0.5999 | |
| MAexp20: | 0.6054 | |
| MAexp50: | 0.6077 | |
| MAexp100: | 0.6075 | |
| Price / MA7: | -1.15% | |
| Price / MA20: | -2.11% | |
| Price / MA50: | -2.72% | |
| Price / MA100: | -1.91% | |
| Price / MAexp7: | -0.95% | |
| Price / MAexp20: | -1.85% | |
| Price / MAexp50: | -2.22% | |
| Price / MAexp100: | -2.19% |
News
The last news published on NZD/USD at the time of the generation of this analysis was as follows:
-
 NZD/USD Forecast July 23, 2024
-
NZD/USD Forecast July 17, 2024
-
NZD/USD Forecast July 16, 2024
-
NZD/USD Forecast July 4, 2024
-
NZD/USD Forecast July 2, 2024
About author

Online


Add a comment
Comments
0 comments on the analysis NZD/USD - Daily