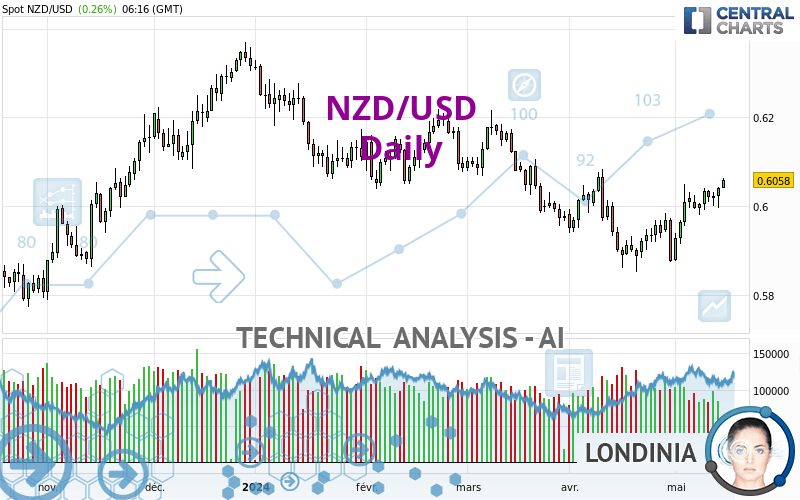
NZD/USD - Daily - Technical analysis published on 05/15/2024 (GMT)
- 74
- 0
Click here for a new analysis!
- Timeframe : Daily
- - Analysis generated on
- Status : TARGET REACHED

Summary of the analysis

Additional analysis
Quotes
The NZD/USD rating is 0.6058 USD. The price registered an increase of +0.27% on the session and was between 0.6041 USD and 0.6064 USD. This implies that the price is at +0.28% from its lowest and at -0.10% from its highest.So that you have an overall view of the price change, here is a table showing the variations over several periods:
Near a new LOW record (1 year)
Type : Bearish
Timeframe : Weekly
Near a new HIGH record (1st january)
Type : Bullish
Timeframe : Weekly
New HIGH record (1 month)
Type : Bullish
Timeframe : Weekly
Technical
Technical analysis of this Daily chart of NZD/USD indicates that the overall trend is not clearly defined. This indecision could turn into a bullish trend due to the strong bullish signals currently being given by short-term moving averages. The Central Indicators scanner detects bullish signals on moving averages that could impact this trend:
Bullish trend reversal : adaptative moving average 100
Type : Bullish
Timeframe : Daily
Bullish price crossover with adaptative moving average 50
Type : Bullish
Timeframe : Daily
Bullish price crossover with adaptative moving average 100
Type : Bullish
Timeframe : Daily
The probability of a further increase is high given the direction of the technical indicators.
Caution: the Central Indicators scanner currently detects an excess:
CCI indicator is overbought : over 100
Type : Neutral
Timeframe : Daily
Williams %R indicator is overbought : over -20
Type : Neutral
Timeframe : Daily
Pivot points : price is over resistance 1
Type : Neutral
Timeframe : Daily
Pivot points : price is over resistance 1
Type : Neutral
Timeframe : Weekly
An analysis of the price chart with the Central Patterns scanner (detector of chart patterns and resistances and supports) shows several results that can have an impact on the price change:
Near horizontal resistance
Type : Bearish
Timeframe : Daily
Resistance of channel is broken
Type : Bullish
Timeframe : Daily
The Central Candlesticks scanner which studies Japanese candlesticks did not detect anything.
| S3 | S2 | S1 | Price | R1 | R2 | R3 | |
|---|---|---|---|---|---|---|---|
| ProTrendLines | 0.5792 | 0.5878 | 0.5973 | 0.6058 | 0.6064 | 0.6106 | 0.6197 |
| Change (%) | -4.39% | -2.97% | -1.40% | - | +0.10% | +0.79% | +2.29% |
| Change | -0.0266 | -0.0180 | -0.0085 | - | +0.0006 | +0.0048 | +0.0139 |
| Level | Minor | Intermediate | Minor | - | Intermediate | Intermediate | Intermediate |
Attention could also be paid to pivot points to set price objectives:
| Pivot points | S3 | S2 | S1 | PP | R1 | R2 | R3 |
|---|---|---|---|---|---|---|---|
| Standard | 0.5961 | 0.5978 | 0.6010 | 0.6027 | 0.6059 | 0.6076 | 0.6108 |
| Camarilla | 0.6029 | 0.6033 | 0.6038 | 0.6042 | 0.6047 | 0.6051 | 0.6056 |
| Woodie | 0.5969 | 0.5982 | 0.6018 | 0.6031 | 0.6067 | 0.6080 | 0.6116 |
| Fibonacci | 0.5978 | 0.5997 | 0.6008 | 0.6027 | 0.6046 | 0.6057 | 0.6076 |
| Pivot points | S3 | S2 | S1 | PP | R1 | R2 | R3 |
|---|---|---|---|---|---|---|---|
| Standard | 0.5928 | 0.5955 | 0.5987 | 0.6014 | 0.6046 | 0.6073 | 0.6105 |
| Camarilla | 0.6004 | 0.6009 | 0.6015 | 0.6020 | 0.6025 | 0.6031 | 0.6036 |
| Woodie | 0.5932 | 0.5956 | 0.5991 | 0.6015 | 0.6050 | 0.6074 | 0.6109 |
| Fibonacci | 0.5955 | 0.5977 | 0.5991 | 0.6014 | 0.6036 | 0.6050 | 0.6073 |
| Pivot points | S3 | S2 | S1 | PP | R1 | R2 | R3 |
|---|---|---|---|---|---|---|---|
| Standard | 0.5561 | 0.5706 | 0.5792 | 0.5937 | 0.6023 | 0.6168 | 0.6254 |
| Camarilla | 0.5814 | 0.5835 | 0.5856 | 0.5877 | 0.5898 | 0.5919 | 0.5941 |
| Woodie | 0.5531 | 0.5691 | 0.5762 | 0.5922 | 0.5993 | 0.6153 | 0.6224 |
| Fibonacci | 0.5706 | 0.5795 | 0.5849 | 0.5937 | 0.6026 | 0.6080 | 0.6168 |
Numerical data
The following is the status of the technical indicators and moving averages at the time of publication of this technical analysis:
| RSI (14): | 60.69 | |
| MACD (12,26,9): | 0.0015 | |
| Directional Movement: | 8.8889 | |
| AROON (14): | 78.5714 | |
| DEMA (21): | 0.6006 | |
| Parabolic SAR (0,02-0,02-0,2): | 0.5914 | |
| Elder Ray (13): | 0.0047 | |
| Super Trend (3,10): | 0.5920 | |
| Zig ZAG (10): | 0.6060 | |
| VORTEX (21): | 1.1865 | |
| Stochastique (14,3,5): | 92.82 | |
| TEMA (21): | 0.6040 | |
| Williams %R (14): | -2.63 | |
| Chande Momentum Oscillator (20): | 0.0089 | |
| Repulse (5,40,3): | 1.0039 | |
| ROCnROLL: | 1 | |
| TRIX (15,9): | -0.0011 | |
| Courbe Coppock: | 3.42 |
| MA7: | 0.6026 | |
| MA20: | 0.5971 | |
| MA50: | 0.6007 | |
| MA100: | 0.6081 | |
| MAexp7: | 0.6027 | |
| MAexp20: | 0.5996 | |
| MAexp50: | 0.6010 | |
| MAexp100: | 0.6041 | |
| Price / MA7: | +0.53% | |
| Price / MA20: | +1.46% | |
| Price / MA50: | +0.85% | |
| Price / MA100: | -0.38% | |
| Price / MAexp7: | +0.51% | |
| Price / MAexp20: | +1.03% | |
| Price / MAexp50: | +0.80% | |
| Price / MAexp100: | +0.28% |
News
Don't forget to follow the news on NZD/USD. At the time of publication of this analysis, the latest news was as follows:
-
 Technical Analysis: 03/04/2024 - NZDUSD halts decline at 23.6% Fibonacci
-
Technical Analysis: 20/03/2024 - NZDUSD in the red again ahead of the Fed
-
Technical Analysis: 07/02/2024 - NZDUSD bounces off 2-month low
-
Technical Analysis: 24/01/2024 - NZDUSD continues to trade sideways
-
Technical Analysis: 17/01/2024 - NZDUSD plummets below 50-day SMA
About author

Online


Add a comment
Comments
0 comments on the analysis NZD/USD - Daily