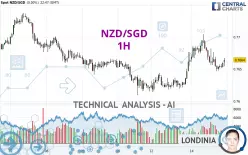
NZD/SGD - 1H - Technical analysis published on 01/14/2025 (GMT)
- 103
- 0
Click here for a new analysis!
- Timeframe : 1H
- - Analysis generated on
- Status : TARGET REACHED

Summary of the analysis

Additional analysis
Quotes
NZD/SGD rating 0.7664 SGD. The price has increased by +0.00% since the last closing with the lowest point at 0.7646 SGD and the highest point at 0.7704 SGD. The deviation from the price is +0.24% for the low point and -0.52% for the high point.The Central Gaps scanner detects a bullish opening marking the presence of buyers ahead of sellers at the opening but not sufficiently marked to allow the price to register a quotation gap.
Bullish opening
Type : Bullish
Timeframe : Openning
A study of price movements over other periods shows the following variations:
Near a new LOW record (5 years)
Type : Bearish
Timeframe : Weekly
Near a new LOW record (1 year)
Type : Bearish
Timeframe : Weekly
Near a new HIGH record (1st january)
Type : Bullish
Timeframe : Weekly
Near a new HIGH record (1 month)
Type : Bullish
Timeframe : Weekly
Technical
Technical analysis of this 1H chart of NZD/SGD indicates that the overall trend is bullish. 64.29% of the signals given by moving averages are bullish. This bullish trend shows slight signs of slowing down given the slightly bullish signals given by the short-term moving averages. The Central Indicators scanner detects bullish signals on moving averages that could impact this trend:
Bullish trend reversal : adaptative moving average 50
Type : Bullish
Timeframe : 1 hour
Bullish trend reversal : adaptative moving average 100
Type : Bullish
Timeframe : 1 hour
In fact, of the 18 technical indicators analysed by Central Analyzer, 7 are bullish, 6 are neutral and 5 are bearish. Central Indicators, the detector scanner for these technical indicators has recently detected several signals:
RSI indicator is back over 50
Type : Bullish
Timeframe : 1 hour
Price is back over the pivot point
Type : Bullish
Timeframe : Weekly
An analysis of the price chart with the Central Patterns scanner (detector of chart patterns and resistances and supports) shows a result that can have an impact on the price change:
Near resistance of channel
Type : Bearish
Timeframe : 1 hour
The Central Candlesticks scanner, specialised in Japanese candlesticks, did not identify any signals.
| S3 | S2 | S1 | Price | R1 | R2 | R3 | |
|---|---|---|---|---|---|---|---|
| ProTrendLines | 0.7619 | 0.7636 | 0.7652 | 0.7664 | 0.7666 | 0.7679 | 0.7701 |
| Change (%) | -0.59% | -0.37% | -0.16% | - | +0.03% | +0.20% | +0.48% |
| Change | -0.0045 | -0.0028 | -0.0012 | - | +0.0002 | +0.0015 | +0.0037 |
| Level | Intermediate | Intermediate | Minor | - | Minor | Intermediate | Minor |
Attention could also be paid to pivot points to set price objectives:
| Pivot points | S3 | S2 | S1 | PP | R1 | R2 | R3 |
|---|---|---|---|---|---|---|---|
| Standard | 0.7565 | 0.7589 | 0.7627 | 0.7651 | 0.7689 | 0.7713 | 0.7751 |
| Camarilla | 0.7647 | 0.7653 | 0.7658 | 0.7664 | 0.7670 | 0.7675 | 0.7681 |
| Woodie | 0.7571 | 0.7593 | 0.7633 | 0.7655 | 0.7695 | 0.7717 | 0.7757 |
| Fibonacci | 0.7589 | 0.7613 | 0.7628 | 0.7651 | 0.7675 | 0.7690 | 0.7713 |
| Pivot points | S3 | S2 | S1 | PP | R1 | R2 | R3 |
|---|---|---|---|---|---|---|---|
| Standard | 0.7446 | 0.7527 | 0.7574 | 0.7655 | 0.7702 | 0.7783 | 0.7830 |
| Camarilla | 0.7585 | 0.7597 | 0.7608 | 0.7620 | 0.7632 | 0.7644 | 0.7655 |
| Woodie | 0.7428 | 0.7519 | 0.7556 | 0.7647 | 0.7684 | 0.7775 | 0.7812 |
| Fibonacci | 0.7527 | 0.7576 | 0.7606 | 0.7655 | 0.7704 | 0.7734 | 0.7783 |
| Pivot points | S3 | S2 | S1 | PP | R1 | R2 | R3 |
|---|---|---|---|---|---|---|---|
| Standard | 0.7210 | 0.7422 | 0.7529 | 0.7741 | 0.7848 | 0.8060 | 0.8167 |
| Camarilla | 0.7549 | 0.7579 | 0.7608 | 0.7637 | 0.7666 | 0.7696 | 0.7725 |
| Woodie | 0.7159 | 0.7396 | 0.7478 | 0.7715 | 0.7797 | 0.8034 | 0.8116 |
| Fibonacci | 0.7422 | 0.7544 | 0.7619 | 0.7741 | 0.7863 | 0.7938 | 0.8060 |
Numerical data
The following is the status of the technical indicators and moving averages at the time of publication of this technical analysis:
| RSI (14): | 52.75 | |
| MACD (12,26,9): | 0.0000 | |
| Directional Movement: | 9.9333 | |
| AROON (14): | -64.2857 | |
| DEMA (21): | 0.7663 | |
| Parabolic SAR (0,02-0,02-0,2): | 0.7672 | |
| Elder Ray (13): | -0.0001 | |
| Super Trend (3,10): | 0.7690 | |
| Zig ZAG (10): | 0.7663 | |
| VORTEX (21): | 0.9492 | |
| Stochastique (14,3,5): | 23.06 | |
| TEMA (21): | 0.7658 | |
| Williams %R (14): | -65.31 | |
| Chande Momentum Oscillator (20): | -0.0016 | |
| Repulse (5,40,3): | 0.1059 | |
| ROCnROLL: | 1 | |
| TRIX (15,9): | 0.0072 | |
| Courbe Coppock: | 0.68 |
| MA7: | 0.7664 | |
| MA20: | 0.7676 | |
| MA50: | 0.7797 | |
| MA100: | 0.7910 | |
| MAexp7: | 0.7659 | |
| MAexp20: | 0.7661 | |
| MAexp50: | 0.7656 | |
| MAexp100: | 0.7656 | |
| Price / MA7: | -0% | |
| Price / MA20: | -0.16% | |
| Price / MA50: | -1.71% | |
| Price / MA100: | -3.11% | |
| Price / MAexp7: | +0.07% | |
| Price / MAexp20: | +0.04% | |
| Price / MAexp50: | +0.10% | |
| Price / MAexp100: | +0.10% |
About author

Online


Add a comment
Comments
0 comments on the analysis NZD/SGD - 1H