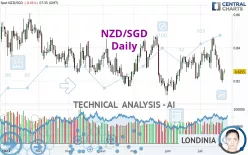
NZD/SGD - Daily - Technical analysis published on 07/25/2023 (GMT)
- 129
- 0
Click here for a new analysis!
- Timeframe : Daily
- - Analysis generated on
- Status : TARGET REACHED

Summary of the analysis

Additional analysis
Quotes
The NZD/SGD price is 0.8255 SGD. The price registered a decrease of -0.01% on the session and was between 0.8244 SGD and 0.8272 SGD. This implies that the price is at +0.13% from its lowest and at -0.21% from its highest.So that you have an overall view of the price change, here is a table showing the variations over several periods:
Near a new LOW record (5 years)
Type : Bearish
Timeframe : Weekly
Near a new LOW record (1 year)
Type : Bearish
Timeframe : Weekly
Near a new HIGH record (1st january)
Type : Bullish
Timeframe : Weekly
Near a new HIGH record (1 month)
Type : Bullish
Timeframe : Weekly
Technical
Technical analysis of this Daily chart of NZD/SGD indicates that the overall trend is strongly bearish. The signals given by moving averages are 82.14% bearish. This strong bearish trend is confirmed by the strong signals currently being given by short-term moving averages. The Central Indicators market scanner currently does not detect any result that concerns moving averages.
In fact, 13 technical indicators on 18 studied are currently positioned bearish. The Central Indicators scanner specialised in technical indicators, has not detected anything further.
The Central Patterns scanner, which studies chart patterns, resistances and supports, has identified these signals:
Near horizontal support
Type : Bullish
Timeframe : Daily
Support of channel is broken
Type : Bearish
Timeframe : Daily
Central Candlesticks, the scanner specialised in Japanese candlesticks, detects this inversion signal that could impact the current short-term trend:
Doji
Type : Neutral
Timeframe : Daily
| S3 | S2 | S1 | Price | R1 | R2 | R3 | |
|---|---|---|---|---|---|---|---|
| ProTrendLines | 0.7931 | 0.8141 | 0.8226 | 0.8255 | 0.8461 | 0.8571 | 0.8697 |
| Change (%) | -3.92% | -1.38% | -0.35% | - | +2.50% | +3.83% | +5.35% |
| Change | -0.0324 | -0.0114 | -0.0029 | - | +0.0206 | +0.0316 | +0.0442 |
| Level | Intermediate | Major | Major | - | Major | Minor | Minor |
Attention could also be paid to pivot points to set price objectives:
| Pivot points | S3 | S2 | S1 | PP | R1 | R2 | R3 |
|---|---|---|---|---|---|---|---|
| Standard | 0.8129 | 0.8159 | 0.8208 | 0.8238 | 0.8287 | 0.8317 | 0.8366 |
| Camarilla | 0.8234 | 0.8242 | 0.8249 | 0.8256 | 0.8263 | 0.8271 | 0.8278 |
| Woodie | 0.8138 | 0.8164 | 0.8217 | 0.8243 | 0.8296 | 0.8322 | 0.8375 |
| Fibonacci | 0.8159 | 0.8190 | 0.8208 | 0.8238 | 0.8269 | 0.8287 | 0.8317 |
| Pivot points | S3 | S2 | S1 | PP | R1 | R2 | R3 |
|---|---|---|---|---|---|---|---|
| Standard | 0.7915 | 0.8059 | 0.8132 | 0.8276 | 0.8349 | 0.8493 | 0.8566 |
| Camarilla | 0.8146 | 0.8166 | 0.8186 | 0.8206 | 0.8226 | 0.8246 | 0.8266 |
| Woodie | 0.7881 | 0.8041 | 0.8098 | 0.8258 | 0.8315 | 0.8475 | 0.8532 |
| Fibonacci | 0.8059 | 0.8142 | 0.8193 | 0.8276 | 0.8359 | 0.8410 | 0.8493 |
| Pivot points | S3 | S2 | S1 | PP | R1 | R2 | R3 |
|---|---|---|---|---|---|---|---|
| Standard | 0.7896 | 0.8005 | 0.8150 | 0.8259 | 0.8404 | 0.8513 | 0.8658 |
| Camarilla | 0.8226 | 0.8249 | 0.8273 | 0.8296 | 0.8319 | 0.8343 | 0.8366 |
| Woodie | 0.7915 | 0.8014 | 0.8169 | 0.8268 | 0.8423 | 0.8522 | 0.8677 |
| Fibonacci | 0.8005 | 0.8102 | 0.8162 | 0.8259 | 0.8356 | 0.8416 | 0.8513 |
Numerical data
The following are the details of the technical indicators and moving averages that were collected to generate this technical analysis:
| RSI (14): | 44.65 | |
| MACD (12,26,9): | -0.0009 | |
| Directional Movement: | -11.4961 | |
| AROON (14): | -50.0000 | |
| DEMA (21): | 0.8302 | |
| Parabolic SAR (0,02-0,02-0,2): | 0.8398 | |
| Elder Ray (13): | -0.0041 | |
| Super Trend (3,10): | 0.8449 | |
| Zig ZAG (10): | 0.8258 | |
| VORTEX (21): | 0.9652 | |
| Stochastique (14,3,5): | 16.69 | |
| TEMA (21): | 0.8286 | |
| Williams %R (14): | -75.55 | |
| Chande Momentum Oscillator (20): | -0.0106 | |
| Repulse (5,40,3): | -0.4981 | |
| ROCnROLL: | 2 | |
| TRIX (15,9): | 0.0187 | |
| Courbe Coppock: | 0.81 |
| MA7: | 0.8281 | |
| MA20: | 0.8317 | |
| MA50: | 0.8291 | |
| MA100: | 0.8296 | |
| MAexp7: | 0.8279 | |
| MAexp20: | 0.8305 | |
| MAexp50: | 0.8303 | |
| MAexp100: | 0.8314 | |
| Price / MA7: | -0.31% | |
| Price / MA20: | -0.75% | |
| Price / MA50: | -0.43% | |
| Price / MA100: | -0.49% | |
| Price / MAexp7: | -0.29% | |
| Price / MAexp20: | -0.60% | |
| Price / MAexp50: | -0.58% | |
| Price / MAexp100: | -0.71% |
About author
Online


Add a comment
Comments
0 comments on the analysis NZD/SGD - Daily