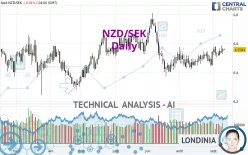
NZD/SEK - Daily - Technical analysis published on 09/12/2023 (GMT)
- 200
- 0
Click here for a new analysis!
- Timeframe : Daily
- - Analysis generated on
- Status : TARGET REACHED
Summary of the analysis

Additional analysis
Quotes
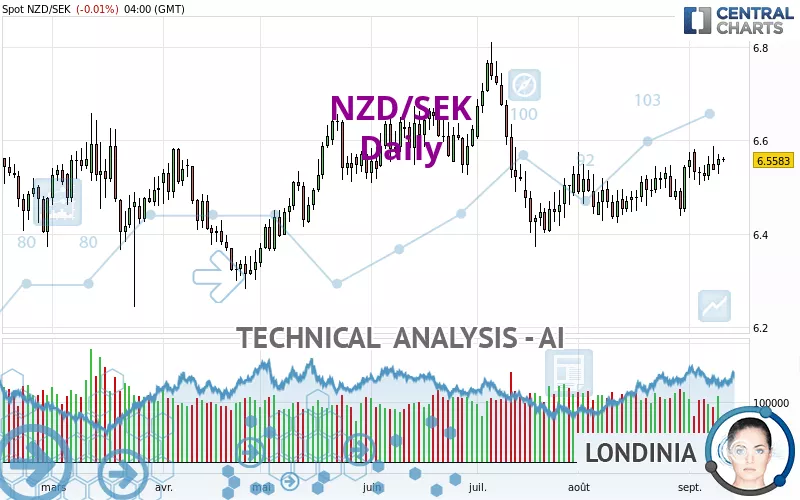
The NZD/SEK rating is 6.5588 SEK. On the day, this instrument lost -0.01% with the lowest point at 6.5524 SEK and the highest point at 6.5651 SEK. The deviation from the price is +0.10% for the low point and -0.10% for the high point.The Central Gaps scanner detects a bullish opening. A small advantage for buyers in the very short term.
Bullish opening
Type : Bullish
Timeframe : Openning
Here is a more detailed summary of the historical variations registered by NZD/SEK:
Near a new HIGH record (1 year)
Type : Bullish
Timeframe : Weekly
Near a new LOW record (1st january)
Type : Bearish
Timeframe : Weekly
Near a new LOW record (1 month)
Type : Bearish
Timeframe : Weekly
Technical
Technical analysis of NZD/SEK in Daily shows an overall bullish trend. The signals returned by the moving averages are 75.00% bullish. This bullish trend is reinforced by the strong signals currently being given by short-term moving averages. The Central Indicators market scanner is currently detecting a bullish signal that could impact this trend:
Moving Average bullish crossovers : MA20 & MA50
Type : Bullish
Timeframe : Daily
The probability of a further increase is high given the direction of the technical indicators.
But beware of excesses. The Central Indicators scanner currently detects this:
CCI indicator is overbought : over 100
Type : Neutral
Timeframe : Daily
Williams %R indicator is overbought : over -20
Type : Neutral
Timeframe : Daily
An analysis of the price chart with the Central Patterns scanner (detector of chart patterns and resistances and supports) shows several results that can have an impact on the price change:
Near horizontal resistance
Type : Bearish
Timeframe : Daily
Resistance of channel is broken
Type : Bullish
Timeframe : Daily
The Central Candlesticks scanner which studies Japanese candlesticks did not detect anything.
| S3 | S2 | S1 | Price | R1 | R2 | R3 | |
|---|---|---|---|---|---|---|---|
| ProTrendLines | 6.4067 | 6.4531 | 6.5294 | 6.5588 | 6.5936 | 6.6572 | 6.7658 |
| Change (%) | -2.32% | -1.61% | -0.45% | - | +0.53% | +1.50% | +3.16% |
| Change | -0.1521 | -0.1057 | -0.0294 | - | +0.0348 | +0.0984 | +0.2070 |
| Level | Major | Minor | Major | - | Intermediate | Major | Minor |
To determine price objectives, it is also possible to use the pivot points. Here is the price position in relation to pivot points:
| Pivot points | S3 | S2 | S1 | PP | R1 | R2 | R3 |
|---|---|---|---|---|---|---|---|
| Standard | 6.4921 | 6.5104 | 6.5348 | 6.5531 | 6.5775 | 6.5958 | 6.6202 |
| Camarilla | 6.5474 | 6.5513 | 6.5552 | 6.5591 | 6.5630 | 6.5669 | 6.5708 |
| Woodie | 6.4951 | 6.5119 | 6.5378 | 6.5546 | 6.5805 | 6.5973 | 6.6232 |
| Fibonacci | 6.5104 | 6.5267 | 6.5368 | 6.5531 | 6.5694 | 6.5795 | 6.5958 |
| Pivot points | S3 | S2 | S1 | PP | R1 | R2 | R3 |
|---|---|---|---|---|---|---|---|
| Standard | 6.4162 | 6.4607 | 6.4982 | 6.5427 | 6.5802 | 6.6247 | 6.6622 |
| Camarilla | 6.5133 | 6.5208 | 6.5283 | 6.5358 | 6.5433 | 6.5508 | 6.5584 |
| Woodie | 6.4128 | 6.4590 | 6.4948 | 6.5410 | 6.5768 | 6.6230 | 6.6588 |
| Fibonacci | 6.4607 | 6.4920 | 6.5113 | 6.5427 | 6.5740 | 6.5933 | 6.6247 |
| Pivot points | S3 | S2 | S1 | PP | R1 | R2 | R3 |
|---|---|---|---|---|---|---|---|
| Standard | 6.3006 | 6.3617 | 6.4525 | 6.5136 | 6.6044 | 6.6655 | 6.7563 |
| Camarilla | 6.5016 | 6.5156 | 6.5295 | 6.5434 | 6.5573 | 6.5713 | 6.5852 |
| Woodie | 6.3156 | 6.3691 | 6.4675 | 6.5210 | 6.6194 | 6.6729 | 6.7713 |
| Fibonacci | 6.3617 | 6.4197 | 6.4555 | 6.5136 | 6.5716 | 6.6074 | 6.6655 |
Numerical data
The following is the status of technical indicators and moving averages registered at the time this technical analysis was created:
| RSI (14): | 57.31 | |
| MACD (12,26,9): | 0.0136 | |
| Directional Movement: | 7.9542 | |
| AROON (14): | 50.0000 | |
| DEMA (21): | 6.5369 | |
| Parabolic SAR (0,02-0,02-0,2): | 6.5020 | |
| Elder Ray (13): | 0.0271 | |
| Super Trend (3,10): | 6.6281 | |
| Zig ZAG (10): | 6.5614 | |
| VORTEX (21): | 1.1073 | |
| Stochastique (14,3,5): | 76.36 | |
| TEMA (21): | 6.5560 | |
| Williams %R (14): | -17.21 | |
| Chande Momentum Oscillator (20): | 0.0309 | |
| Repulse (5,40,3): | 0.0784 | |
| ROCnROLL: | 1 | |
| TRIX (15,9): | 0.0165 | |
| Courbe Coppock: | 1.44 |
| MA7: | 6.5417 | |
| MA20: | 6.5170 | |
| MA50: | 6.5145 | |
| MA100: | 6.5295 | |
| MAexp7: | 6.5440 | |
| MAexp20: | 6.5231 | |
| MAexp50: | 6.5200 | |
| MAexp100: | 6.5214 | |
| Price / MA7: | +0.26% | |
| Price / MA20: | +0.64% | |
| Price / MA50: | +0.68% | |
| Price / MA100: | +0.45% | |
| Price / MAexp7: | +0.23% | |
| Price / MAexp20: | +0.55% | |
| Price / MAexp50: | +0.60% | |
| Price / MAexp100: | +0.57% |
About author
Online


Add a comment
Comments
0 comments on the analysis NZD/SEK - Daily