| Open: | 87,218.69 |
| Change: | -1,973.07 |
| Volume: | 30,977 |
| Low: | 85,135.13 |
| High: | 87,492.20 |
| High / Low range: | 2,357.07 |
| Type: | Forex |
| Ticker: | NZDSEK |
| ISIN: |
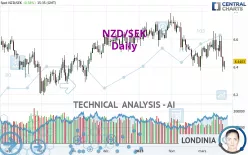
NZD/SEK - Daily - Technical analysis published on 03/22/2023 (GMT)
- 136
- 0
- 03/22/2023 - 15:35
Click here for a new analysis!
- Timeframe : Daily
- - Analysis generated on 03/22/2023 - 15:35
- Status : TARGET REACHED

Summary of the analysis

Additional analysis
Quotes
The NZD/SEK rating is 6.4403 SEK. The price has increased by +0.58% since the last closing and was traded between 6.3827 SEK and 6.4439 SEK over the period. The price is currently at +0.90% from its lowest and -0.06% from its highest.The Central Gaps scanner detects a bearish opening marking the presence of sellers ahead of buyers at the opening but not sufficiently marked to allow the price to register a quotation gap.
Bearish opening
Type : Bearish
Timeframe : Openning
A study of price movements over other periods shows the following variations:
Near a new HIGH record (5 years)
Type : Bullish
Timeframe : Weekly
Near a new LOW record (1 year)
Type : Bearish
Timeframe : Weekly
Near a new LOW record (1st january)
Type : Bearish
Timeframe : Weekly
Near a new HIGH record (1 month)
Type : Bullish
Timeframe : Weekly
Technical
Technical analysis of NZD/SEK in Daily shows a overall strongly bearish trend. The signals given by moving averages are 85.71% bearish. This strong bearish trend is confirmed by the strong signals currently being given by short-term moving averages. The Central Indicators scanner detects a bearish signal on moving averages that could impact this trend:
Bearish trend reversal : Moving Average 100
Type : Bearish
Timeframe : Daily
In fact, according to the parameters integrated into the Central Analyzer system, 11 technical indicators out of 18 analysed are currently bearish. Caution: the Central Indicators scanner currently detects an excess:
CCI indicator is oversold : under -100
Type : Neutral
Timeframe : Daily
Previous candle closed under Bollinger bands
Type : Neutral
Timeframe : Daily
RSI indicator: bullish divergence
Type : Bullish
Timeframe : Daily
Pivot points : price is under support 1
Type : Neutral
Timeframe : Weekly
Price is back over the pivot point
Type : Bullish
Timeframe : Daily
The Central Patterns scanner, which studies chart patterns, resistances and supports, has identified these signals:
Horizontal resistance is broken
Type : Bullish
Timeframe : Daily
Support of channel is broken
Type : Bearish
Timeframe : Daily
The Central Candlesticks scanner, specialised in Japanese candlesticks, did not identify any signals.
| S3 | S2 | S1 | Price | R1 | R2 | R3 | |
|---|---|---|---|---|---|---|---|
| ProTrendLines | 6.3204 | 6.3609 | 6.4025 | 6.4403 | 6.4643 | 6.5071 | 6.6176 |
| Change (%) | -1.86% | -1.23% | -0.59% | - | +0.37% | +1.04% | +2.75% |
| Change | -0.1199 | -0.0794 | -0.0378 | - | +0.0240 | +0.0668 | +0.1773 |
| Level | Major | Major | Intermediate | - | Intermediate | Intermediate | Major |
Attention could also be paid to pivot points to set price objectives:
| Pivot points | S3 | S2 | S1 | PP | R1 | R2 | R3 |
|---|---|---|---|---|---|---|---|
| Standard | 6.2461 | 6.3059 | 6.3547 | 6.4145 | 6.4633 | 6.5231 | 6.5719 |
| Camarilla | 6.3735 | 6.3835 | 6.3935 | 6.4034 | 6.4134 | 6.4233 | 6.4333 |
| Woodie | 6.2405 | 6.3032 | 6.3491 | 6.4118 | 6.4577 | 6.5204 | 6.5663 |
| Fibonacci | 6.3059 | 6.3474 | 6.3731 | 6.4145 | 6.4560 | 6.4817 | 6.5231 |
| Pivot points | S3 | S2 | S1 | PP | R1 | R2 | R3 |
|---|---|---|---|---|---|---|---|
| Standard | 6.2697 | 6.3616 | 6.4747 | 6.5666 | 6.6797 | 6.7716 | 6.8847 |
| Camarilla | 6.5313 | 6.5501 | 6.5689 | 6.5877 | 6.6065 | 6.6253 | 6.6441 |
| Woodie | 6.2802 | 6.3669 | 6.4852 | 6.5719 | 6.6902 | 6.7769 | 6.8952 |
| Fibonacci | 6.3616 | 6.4399 | 6.4883 | 6.5666 | 6.6449 | 6.6933 | 6.7716 |
| Pivot points | S3 | S2 | S1 | PP | R1 | R2 | R3 |
|---|---|---|---|---|---|---|---|
| Standard | 5.9198 | 6.1463 | 6.3118 | 6.5383 | 6.7038 | 6.9303 | 7.0958 |
| Camarilla | 6.3696 | 6.4055 | 6.4415 | 6.4774 | 6.5133 | 6.5493 | 6.5852 |
| Woodie | 5.8894 | 6.1311 | 6.2814 | 6.5231 | 6.6734 | 6.9151 | 7.0654 |
| Fibonacci | 6.1463 | 6.2960 | 6.3885 | 6.5383 | 6.6880 | 6.7805 | 6.9303 |
Numerical data
The following is the status of technical indicators and moving averages registered at the time this technical analysis was created:
| RSI (14): | 42.10 | |
| MACD (12,26,9): | -0.0242 | |
| Directional Movement: | -9.4151 | |
| AROON (14): | -42.8571 | |
| DEMA (21): | 6.4849 | |
| Parabolic SAR (0,02-0,02-0,2): | 6.6316 | |
| Elder Ray (13): | -0.0899 | |
| Super Trend (3,10): | 6.6379 | |
| Zig ZAG (10): | 6.4413 | |
| VORTEX (21): | 0.9868 | |
| Stochastique (14,3,5): | 16.13 | |
| TEMA (21): | 6.4789 | |
| Williams %R (14): | -74.52 | |
| Chande Momentum Oscillator (20): | -0.0355 | |
| Repulse (5,40,3): | -0.6944 | |
| ROCnROLL: | 2 | |
| TRIX (15,9): | -0.0407 | |
| Courbe Coppock: | 0.00 |
| MA7: | 6.4975 | |
| MA20: | 6.5099 | |
| MA50: | 6.5786 | |
| MA100: | 6.5662 | |
| MAexp7: | 6.4839 | |
| MAexp20: | 6.5158 | |
| MAexp50: | 6.5469 | |
| MAexp100: | 6.5427 | |
| Price / MA7: | -0.88% | |
| Price / MA20: | -1.07% | |
| Price / MA50: | -2.10% | |
| Price / MA100: | -1.92% | |
| Price / MAexp7: | -0.67% | |
| Price / MAexp20: | -1.16% | |
| Price / MAexp50: | -1.63% | |
| Price / MAexp100: | -1.57% |
About author
Online


Add a comment
Comments
0 comments on the analysis NZD/SEK - Daily