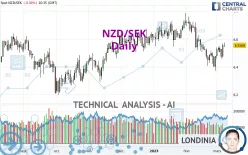
NZD/SEK - Daily - Technical analysis published on 03/08/2023 (GMT)
- 144
- 0
- Timeframe : Daily
- - Analysis generated on
- Status : NEUTRAL

Summary of the analysis

Additional analysis
Quotes
NZD/SEK rating 6.5568 SEK. The price registered a decrease of -0.01% on the session with the lowest point at 6.5434 SEK and the highest point at 6.5773 SEK. The deviation from the price is +0.20% for the low point and -0.31% for the high point.So that you have an overall view of the price change, here is a table showing the variations over several periods:
Near a new HIGH record (1 year)
Type : Bullish
Timeframe : Weekly
Near a new HIGH record (1st january)
Type : Bullish
Timeframe : Weekly
Near a new LOW record (1 month)
Type : Bearish
Timeframe : Weekly
Technical
Technical analysis of NZD/SEK in Daily shows an overall slightly bullish trend. 46.43% of the signals given by moving averages are bullish. As the signals currently given by short-term moving averages are rather neutral, the overall trend could quickly return to neutral as well. The Central Indicators market scanner is currently detecting several bullish signals that could impact this trend:
Bullish trend reversal : adaptative moving average 20
Type : Bullish
Timeframe : Daily
Bullish trend reversal : adaptative moving average 100
Type : Bullish
Timeframe : Daily
In fact, according to the parameters integrated into the Central Analyzer system, 12 technical indicators out of 18 analysed are currently bullish. But beware of excesses. The Central Indicators scanner currently detects this:
Williams %R indicator is overbought : over -20
Type : Neutral
Timeframe : Daily
Central Patterns, the market scanner focusing on chart patterns, resistances and supports found this result:
Near resistance of channel
Type : Bearish
Timeframe : Daily
There is also a Japanese candlestick pattern detected by Central Candlesticks that could mark the end of the current short-term trend:
Doji
Type : Neutral
Timeframe : Daily
| S3 | S2 | S1 | Price | R1 | R2 | R3 | |
|---|---|---|---|---|---|---|---|
| ProTrendLines | 6.3609 | 6.4541 | 6.5071 | 6.5568 | 6.5608 | 6.6176 | 6.6572 |
| Change (%) | -2.99% | -1.57% | -0.76% | - | +0.06% | +0.93% | +1.53% |
| Change | -0.1959 | -0.1027 | -0.0497 | - | +0.0040 | +0.0608 | +0.1004 |
| Level | Major | Intermediate | Minor | - | Major | Major | Major |
To determine price objectives, it is also possible to use the pivot points. Here is the price position in relation to pivot points:
| Pivot points | S3 | S2 | S1 | PP | R1 | R2 | R3 |
|---|---|---|---|---|---|---|---|
| Standard | 6.3927 | 6.4304 | 6.4937 | 6.5314 | 6.5947 | 6.6324 | 6.6957 |
| Camarilla | 6.5293 | 6.5386 | 6.5478 | 6.5571 | 6.5664 | 6.5756 | 6.5849 |
| Woodie | 6.4056 | 6.4368 | 6.5066 | 6.5378 | 6.6076 | 6.6388 | 6.7086 |
| Fibonacci | 6.4304 | 6.4690 | 6.4928 | 6.5314 | 6.5700 | 6.5938 | 6.6324 |
| Pivot points | S3 | S2 | S1 | PP | R1 | R2 | R3 |
|---|---|---|---|---|---|---|---|
| Standard | 6.2298 | 6.3013 | 6.4059 | 6.4774 | 6.5820 | 6.6535 | 6.7581 |
| Camarilla | 6.4622 | 6.4783 | 6.4945 | 6.5106 | 6.5267 | 6.5429 | 6.5590 |
| Woodie | 6.2465 | 6.3096 | 6.4226 | 6.4857 | 6.5987 | 6.6618 | 6.7748 |
| Fibonacci | 6.3013 | 6.3685 | 6.4101 | 6.4774 | 6.5446 | 6.5862 | 6.6535 |
| Pivot points | S3 | S2 | S1 | PP | R1 | R2 | R3 |
|---|---|---|---|---|---|---|---|
| Standard | 5.9198 | 6.1463 | 6.3118 | 6.5383 | 6.7038 | 6.9303 | 7.0958 |
| Camarilla | 6.3696 | 6.4055 | 6.4415 | 6.4774 | 6.5133 | 6.5493 | 6.5852 |
| Woodie | 5.8894 | 6.1311 | 6.2814 | 6.5231 | 6.6734 | 6.9151 | 7.0654 |
| Fibonacci | 6.1463 | 6.2960 | 6.3885 | 6.5383 | 6.6880 | 6.7805 | 6.9303 |
Numerical data
The following is the status of the technical indicators and moving averages at the time of publication of this technical analysis:
| RSI (14): | 51.21 | |
| MACD (12,26,9): | -0.0242 | |
| Directional Movement: | -9.5837 | |
| AROON (14): | 42.8571 | |
| DEMA (21): | 6.4978 | |
| Parabolic SAR (0,02-0,02-0,2): | 6.4129 | |
| Elder Ray (13): | 0.0388 | |
| Super Trend (3,10): | 6.6379 | |
| Zig ZAG (10): | 6.5564 | |
| VORTEX (21): | 0.9055 | |
| Stochastique (14,3,5): | 79.21 | |
| TEMA (21): | 6.4904 | |
| Williams %R (14): | -10.36 | |
| Chande Momentum Oscillator (20): | 0.0810 | |
| Repulse (5,40,3): | 0.6074 | |
| ROCnROLL: | -1 | |
| TRIX (15,9): | -0.0826 | |
| Courbe Coppock: | 1.09 |
| MA7: | 6.5196 | |
| MA20: | 6.5162 | |
| MA50: | 6.6017 | |
| MA100: | 6.5534 | |
| MAexp7: | 6.5221 | |
| MAexp20: | 6.5339 | |
| MAexp50: | 6.5635 | |
| MAexp100: | 6.5495 | |
| Price / MA7: | +0.57% | |
| Price / MA20: | +0.62% | |
| Price / MA50: | -0.68% | |
| Price / MA100: | +0.05% | |
| Price / MAexp7: | +0.53% | |
| Price / MAexp20: | +0.35% | |
| Price / MAexp50: | -0.10% | |
| Price / MAexp100: | +0.11% |
About author
Online


Add a comment
Comments
0 comments on the analysis NZD/SEK - Daily