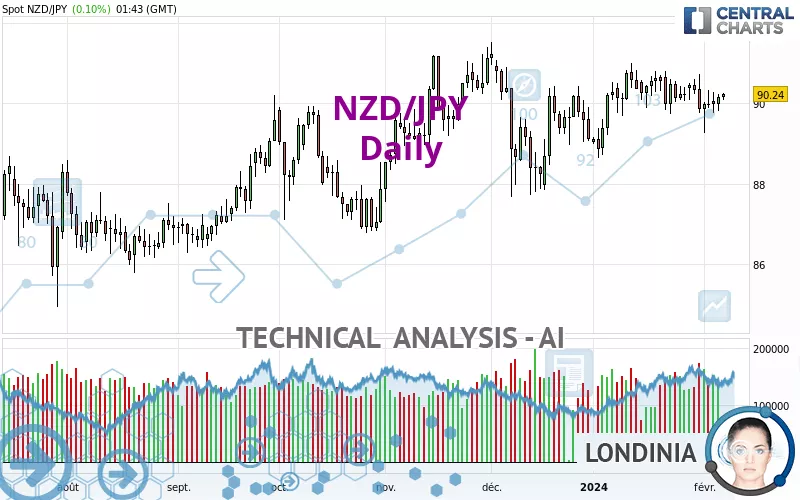
NZD/JPY - Daily - Technical analysis published on 02/07/2024 (GMT)
- 201
- 0
Click here for a new analysis!
- Timeframe : Daily
- - Analysis generated on
- Status : TARGET REACHED

Summary of the analysis

Additional analysis
Quotes
The NZD/JPY rating is 90.23 JPY. On the day, this instrument gained +0.09% with the lowest point at 90.09 JPY and the highest point at 90.25 JPY. The deviation from the price is +0.16% for the low point and -0.02% for the high point.The Central Gaps scanner detects a bullish opening. A small advantage for buyers in the very short term.
Bullish opening
Type : Bullish
Timeframe : Openning
So that you have an overall view of the price change, here is a table showing the variations over several periods:
Near a new HIGH record (5 years)
Type : Bullish
Timeframe : Weekly
Near a new HIGH record (1 year)
Type : Bullish
Timeframe : Weekly
Near a new LOW record (1st january)
Type : Bearish
Timeframe : Weekly
Near a new HIGH record (1 month)
Type : Bullish
Timeframe : Weekly
Technical
A technical analysis in Daily of this NZD/JPY chart shows a bullish trend. The signals given by moving averages are 75.00% bullish. This bullish trend is slowing down slightly given the slightly bullish signals of short-term moving averages. The Central Indicators market scanner is currently detecting a bullish signal that could impact this trend:
Bullish trend reversal : adaptative moving average 20
Type : Bullish
Timeframe : Daily
Technical indicators are slightly bullish. There is therefore considerable uncertainty about the continuation of the increase.
Central Indicators, the scanner specialised in technical indicators, has identified this signal:
Momentum indicator is back over 0
Type : Bullish
Timeframe : Daily
The Central Patterns scanner, which studies chart patterns, resistances and supports, has identified these signals:
Near resistance of triangle
Type : Bearish
Timeframe : Daily
Near support of channel
Type : Bullish
Timeframe : Daily
The Central Candlesticks scanner which studies Japanese candlesticks did not detect anything.
| S3 | S2 | S1 | Price | R1 | R2 | |
|---|---|---|---|---|---|---|
| ProTrendLines | 87.76 | 89.53 | 90.20 | 90.23 | 91.22 | 93.84 |
| Change (%) | -2.74% | -0.78% | -0.03% | - | +1.10% | +4.00% |
| Change | -2.47 | -0.70 | -0.03 | - | +0.99 | +3.61 |
| Level | Major | Major | Intermediate | - | Major | Intermediate |
Pivot points can also be used to set your price objectives. Here is the price situation in relation to pivot points:
| Pivot points | S3 | S2 | S1 | PP | R1 | R2 | R3 |
|---|---|---|---|---|---|---|---|
| Standard | 89.45 | 89.62 | 89.89 | 90.06 | 90.33 | 90.50 | 90.77 |
| Camarilla | 90.03 | 90.07 | 90.11 | 90.15 | 90.19 | 90.23 | 90.27 |
| Woodie | 89.49 | 89.65 | 89.93 | 90.09 | 90.37 | 90.53 | 90.81 |
| Fibonacci | 89.62 | 89.79 | 89.90 | 90.06 | 90.23 | 90.34 | 90.50 |
| Pivot points | S3 | S2 | S1 | PP | R1 | R2 | R3 |
|---|---|---|---|---|---|---|---|
| Standard | 87.78 | 88.51 | 89.25 | 89.98 | 90.72 | 91.45 | 92.19 |
| Camarilla | 89.58 | 89.71 | 89.85 | 89.98 | 90.12 | 90.25 | 90.38 |
| Woodie | 87.78 | 88.51 | 89.25 | 89.98 | 90.72 | 91.45 | 92.19 |
| Fibonacci | 88.51 | 89.08 | 89.42 | 89.98 | 90.55 | 90.89 | 91.45 |
| Pivot points | S3 | S2 | S1 | PP | R1 | R2 | R3 |
|---|---|---|---|---|---|---|---|
| Standard | 86.30 | 87.47 | 88.66 | 89.83 | 91.02 | 92.19 | 93.38 |
| Camarilla | 89.21 | 89.43 | 89.64 | 89.86 | 90.08 | 90.29 | 90.51 |
| Woodie | 86.32 | 87.48 | 88.68 | 89.84 | 91.04 | 92.20 | 93.40 |
| Fibonacci | 87.47 | 88.37 | 88.93 | 89.83 | 90.73 | 91.29 | 92.19 |
Numerical data
The following is the status of technical indicators and moving averages registered at the time this technical analysis was created:
| RSI (14): | 51.94 | |
| MACD (12,26,9): | 0.0400 | |
| Directional Movement: | -5.97 | |
| AROON (14): | -71.43 | |
| DEMA (21): | 90.22 | |
| Parabolic SAR (0,02-0,02-0,2): | 90.59 | |
| Elder Ray (13): | 0.01 | |
| Super Trend (3,10): | 90.98 | |
| Zig ZAG (10): | 90.21 | |
| VORTEX (21): | 1.0400 | |
| Stochastique (14,3,5): | 55.13 | |
| TEMA (21): | 90.13 | |
| Williams %R (14): | -38.46 | |
| Chande Momentum Oscillator (20): | 0.24 | |
| Repulse (5,40,3): | 0.1900 | |
| ROCnROLL: | 1 | |
| TRIX (15,9): | 0.0200 | |
| Courbe Coppock: | 0.73 |
| MA7: | 90.07 | |
| MA20: | 90.27 | |
| MA50: | 89.95 | |
| MA100: | 89.38 | |
| MAexp7: | 90.13 | |
| MAexp20: | 90.14 | |
| MAexp50: | 89.89 | |
| MAexp100: | 89.25 | |
| Price / MA7: | +0.18% | |
| Price / MA20: | -0.04% | |
| Price / MA50: | +0.31% | |
| Price / MA100: | +0.95% | |
| Price / MAexp7: | +0.11% | |
| Price / MAexp20: | +0.10% | |
| Price / MAexp50: | +0.38% | |
| Price / MAexp100: | +1.10% |
News
The latest news and videos published on NZD/JPY at the time of the analysis were as follows:
-
 NZD/JPY Can Take Advantage of, But Not Dependent on Risk Appetite (Quick Takes Video)
-
Technica Focus: Big Confluence in NZD/JPY
-
Why selling the NZD/JPY could be ‘a good short-term trade’
About author

Online


Add a comment
Comments
0 comments on the analysis NZD/JPY - Daily