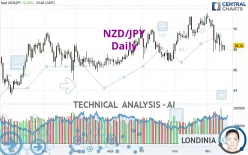
NZD/JPY - Daily - Technical analysis published on 12/17/2023 (GMT)
- 196
- 0
Click here for a new analysis!
- Timeframe : Daily
- - Analysis generated on
- Status : INVALID

Summary of the analysis

Additional analysis
Quotes
NZD/JPY rating 88.33 JPY. On the day, this instrument gained +0.09% and was traded between 87.85 JPY and 88.40 JPY over the period. The price is currently at +0.55% from its lowest and -0.08% from its highest.The Central Gaps scanner detects a bearish opening marking the presence of sellers ahead of buyers at the opening but not sufficiently marked to allow the price to register a quotation gap.
Bearish opening
Type : Bearish
Timeframe : Openning
Here is a more detailed summary of the historical variations registered by NZD/JPY:
Near a new HIGH record (5 years)
Type : Bullish
Timeframe : Weekly
Near a new HIGH record (1 year)
Type : Bullish
Timeframe : Weekly
Near a new HIGH record (1st january)
Type : Bullish
Timeframe : Weekly
Near a new HIGH record (1 month)
Type : Bullish
Timeframe : Weekly
Technical
A technical analysis in Daily of this NZD/JPY chart shows a slightly bearish trend. Only 57.14% of the signals given by moving averages are bearish. This slightly bearish trend is reinforced by the strong signals currently being given by short-term moving averages. There is no crossing of moving average by the price or crossing of moving averages between themselves.
In fact, 11 technical indicators on 18 studied are currently bearish. But beware of excesses. The Central Indicators scanner currently detects this:
CCI indicator is oversold : under -100
Type : Neutral
Timeframe : Daily
RSI indicator: bullish divergence
Type : Bullish
Timeframe : Daily
Williams %R indicator is oversold : under -80
Type : Neutral
Timeframe : Daily
Price is back over the pivot point
Type : Bullish
Timeframe : Daily
The Central Patterns scanner, which studies chart patterns, resistances and supports, has identified these signals:
Near support of channel
Type : Bullish
Timeframe : Daily
Near support of triangle
Type : Bullish
Timeframe : Daily
No result was found by the Central Candlesticks scanner on Japanese candlesticks.
| S3 | S2 | S1 | Price | R1 | R2 | R3 | |
|---|---|---|---|---|---|---|---|
| ProTrendLines | 83.72 | 85.94 | 87.76 | 88.33 | 89.53 | 90.38 | 91.20 |
| Change (%) | -5.22% | -2.71% | -0.65% | - | +1.36% | +2.32% | +3.25% |
| Change | -4.61 | -2.39 | -0.57 | - | +1.20 | +2.05 | +2.87 |
| Level | Major | Intermediate | Major | - | Major | Minor | Intermediate |
Attention could also be paid to pivot points to set price objectives:
| Pivot points | S3 | S2 | S1 | PP | R1 | R2 | R3 |
|---|---|---|---|---|---|---|---|
| Standard | 87.35 | 87.60 | 87.93 | 88.18 | 88.51 | 88.76 | 89.09 |
| Camarilla | 88.09 | 88.14 | 88.20 | 88.25 | 88.30 | 88.36 | 88.41 |
| Woodie | 87.38 | 87.62 | 87.96 | 88.20 | 88.54 | 88.78 | 89.12 |
| Fibonacci | 87.60 | 87.83 | 87.96 | 88.18 | 88.41 | 88.54 | 88.76 |
| Pivot points | S3 | S2 | S1 | PP | R1 | R2 | R3 |
|---|---|---|---|---|---|---|---|
| Standard | 85.50 | 86.62 | 87.43 | 88.55 | 89.36 | 90.48 | 91.29 |
| Camarilla | 87.72 | 87.90 | 88.07 | 88.25 | 88.43 | 88.60 | 88.78 |
| Woodie | 85.36 | 86.54 | 87.29 | 88.47 | 89.22 | 90.40 | 91.15 |
| Fibonacci | 86.62 | 87.35 | 87.81 | 88.55 | 89.28 | 89.74 | 90.48 |
| Pivot points | S3 | S2 | S1 | PP | R1 | R2 | R3 |
|---|---|---|---|---|---|---|---|
| Standard | 84.81 | 86.18 | 88.65 | 90.02 | 92.49 | 93.86 | 96.33 |
| Camarilla | 90.06 | 90.42 | 90.77 | 91.12 | 91.47 | 91.82 | 92.18 |
| Woodie | 85.36 | 86.46 | 89.20 | 90.30 | 93.04 | 94.14 | 96.88 |
| Fibonacci | 86.18 | 87.65 | 88.55 | 90.02 | 91.49 | 92.39 | 93.86 |
Numerical data
The following is the status of technical indicators and moving averages registered at the time this technical analysis was created:
| RSI (14): | 40.19 | |
| MACD (12,26,9): | -0.2700 | |
| Directional Movement: | -12.80 | |
| AROON (14): | -28.57 | |
| DEMA (21): | 89.13 | |
| Parabolic SAR (0,02-0,02-0,2): | 90.52 | |
| Elder Ray (13): | -1.00 | |
| Super Trend (3,10): | 90.84 | |
| Zig ZAG (10): | 88.35 | |
| VORTEX (21): | 0.9100 | |
| Stochastique (14,3,5): | 17.01 | |
| TEMA (21): | 88.58 | |
| Williams %R (14): | -82.81 | |
| Chande Momentum Oscillator (20): | -2.77 | |
| Repulse (5,40,3): | 0.4900 | |
| ROCnROLL: | 2 | |
| TRIX (15,9): | 0.0100 | |
| Courbe Coppock: | 3.92 |
| MA7: | 88.66 | |
| MA20: | 89.78 | |
| MA50: | 89.11 | |
| MA100: | 88.24 | |
| MAexp7: | 88.72 | |
| MAexp20: | 89.31 | |
| MAexp50: | 89.12 | |
| MAexp100: | 88.41 | |
| Price / MA7: | -0.37% | |
| Price / MA20: | -1.62% | |
| Price / MA50: | -0.88% | |
| Price / MA100: | +0.10% | |
| Price / MAexp7: | -0.44% | |
| Price / MAexp20: | -1.10% | |
| Price / MAexp50: | -0.89% | |
| Price / MAexp100: | -0.09% |
News
The last news published on NZD/JPY at the time of the generation of this analysis was as follows:
-
 NZD/JPY Can Take Advantage of, But Not Dependent on Risk Appetite (Quick Takes Video)
-
Technica Focus: Big Confluence in NZD/JPY
-
Why selling the NZD/JPY could be ‘a good short-term trade’
About author

Online


Add a comment
Comments
0 comments on the analysis NZD/JPY - Daily