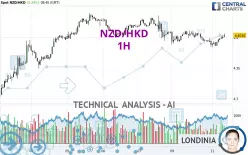
NZD/HKD - 1H - Technical analysis published on 02/11/2025 (GMT)
- 111
- 0
Click here for a new analysis!
- Timeframe : 1H
- - Analysis generated on
- Status : INVALID

Summary of the analysis

Additional analysis
Quotes
The NZD/HKD rating is 4.4043 HKD. The price has increased by +0.37% since the last closing with the lowest point at 4.3844 HKD and the highest point at 4.4066 HKD. The deviation from the price is +0.45% for the low point and -0.05% for the high point.A bullish opening was detected by the Central Gaps scanner. Buyers are trying to impose a bullish momentum in the very short term.
Bullish opening
Type : Bullish
Timeframe : Openning
Here is a more detailed summary of the historical variations registered by NZD/HKD:
Near a new LOW record (5 years)
Type : Bearish
Timeframe : Weekly
Near a new LOW record (1 year)
Type : Bearish
Timeframe : Weekly
Near a new LOW record (1st january)
Type : Bearish
Timeframe : Weekly
Near a new LOW record (1 month)
Type : Bearish
Timeframe : Weekly
Technical
A technical analysis in 1H of this NZD/HKD chart shows a neutral trend. This indecision could turn into a bullish trend due to the strong bullish signals currently being given by short-term moving averages. The Central Indicators scanner detects bullish signals on moving averages that could impact this trend:
Bullish price crossover with Moving Average 50
Type : Bullish
Timeframe : 1 hour
Bullish price crossover with adaptative moving average 20
Type : Bullish
Timeframe : 1 hour
Technical indicators are strongly bullish, suggesting that the price increase should continue.
But beware of excesses. The Central Indicators scanner currently detects this:
CCI indicator is overbought : over 100
Type : Neutral
Timeframe : 1 hour
Williams %R indicator is overbought : over -20
Type : Neutral
Timeframe : 1 hour
The Central Patterns scanner, which studies chart patterns, resistances and supports, has identified these signals:
Near horizontal resistance
Type : Bearish
Timeframe : 1 hour
Resistance of channel is broken
Type : Bullish
Timeframe : 1 hour
The Central Candlesticks scanner which studies Japanese candlesticks did not detect anything.
| S3 | S2 | S1 | Price | R1 | R2 | R3 | |
|---|---|---|---|---|---|---|---|
| ProTrendLines | 4.3700 | 4.3814 | 4.3997 | 4.4043 | 4.4109 | 4.4279 | 4.4440 |
| Change (%) | -0.78% | -0.52% | -0.10% | - | +0.15% | +0.54% | +0.90% |
| Change | -0.0343 | -0.0229 | -0.0046 | - | +0.0066 | +0.0236 | +0.0397 |
| Level | Major | Major | Intermediate | - | Intermediate | Minor | Major |
To determine price objectives, it is also possible to use the pivot points. Here is the price position in relation to pivot points:
| Pivot points | S3 | S2 | S1 | PP | R1 | R2 | R3 |
|---|---|---|---|---|---|---|---|
| Standard | 4.3507 | 4.3675 | 4.3779 | 4.3947 | 4.4051 | 4.4219 | 4.4323 |
| Camarilla | 4.3808 | 4.3833 | 4.3858 | 4.3883 | 4.3908 | 4.3933 | 4.3958 |
| Woodie | 4.3475 | 4.3659 | 4.3747 | 4.3931 | 4.4019 | 4.4203 | 4.4291 |
| Fibonacci | 4.3675 | 4.3779 | 4.3843 | 4.3947 | 4.4051 | 4.4115 | 4.4219 |
| Pivot points | S3 | S2 | S1 | PP | R1 | R2 | R3 |
|---|---|---|---|---|---|---|---|
| Standard | 4.1851 | 4.2421 | 4.3258 | 4.3828 | 4.4665 | 4.5235 | 4.6072 |
| Camarilla | 4.3707 | 4.3836 | 4.3965 | 4.4094 | 4.4223 | 4.4352 | 4.4481 |
| Woodie | 4.1984 | 4.2488 | 4.3391 | 4.3895 | 4.4798 | 4.5302 | 4.6205 |
| Fibonacci | 4.2421 | 4.2959 | 4.3291 | 4.3828 | 4.4366 | 4.4698 | 4.5235 |
| Pivot points | S3 | S2 | S1 | PP | R1 | R2 | R3 |
|---|---|---|---|---|---|---|---|
| Standard | 4.1785 | 4.2469 | 4.3201 | 4.3885 | 4.4617 | 4.5301 | 4.6033 |
| Camarilla | 4.3543 | 4.3672 | 4.3802 | 4.3932 | 4.4062 | 4.4192 | 4.4321 |
| Woodie | 4.1808 | 4.2481 | 4.3224 | 4.3897 | 4.4640 | 4.5313 | 4.6056 |
| Fibonacci | 4.2469 | 4.3010 | 4.3344 | 4.3885 | 4.4426 | 4.4760 | 4.5301 |
Numerical data
The following are the details of the technical indicators and moving averages that were collected to generate this technical analysis:
| RSI (14): | 58.22 | |
| MACD (12,26,9): | -0.0011 | |
| Directional Movement: | 5.7567 | |
| AROON (14): | 64.2857 | |
| DEMA (21): | 4.3955 | |
| Parabolic SAR (0,02-0,02-0,2): | 4.3864 | |
| Elder Ray (13): | 0.0062 | |
| Super Trend (3,10): | 4.4066 | |
| Zig ZAG (10): | 4.4049 | |
| VORTEX (21): | 0.9701 | |
| Stochastique (14,3,5): | 85.44 | |
| TEMA (21): | 4.3970 | |
| Williams %R (14): | -11.21 | |
| Chande Momentum Oscillator (20): | 0.0087 | |
| Repulse (5,40,3): | 0.1694 | |
| ROCnROLL: | 1 | |
| TRIX (15,9): | -0.0096 | |
| Courbe Coppock: | 0.09 |
| MA7: | 4.4041 | |
| MA20: | 4.4024 | |
| MA50: | 4.4200 | |
| MA100: | 4.5559 | |
| MAexp7: | 4.3984 | |
| MAexp20: | 4.3978 | |
| MAexp50: | 4.4019 | |
| MAexp100: | 4.4032 | |
| Price / MA7: | +0.00% | |
| Price / MA20: | +0.04% | |
| Price / MA50: | -0.36% | |
| Price / MA100: | -3.33% | |
| Price / MAexp7: | +0.11% | |
| Price / MAexp20: | +0.13% | |
| Price / MAexp50: | +0.03% | |
| Price / MAexp100: | +0.00% |
About author
Online


Add a comment
Comments
0 comments on the analysis NZD/HKD - 1H