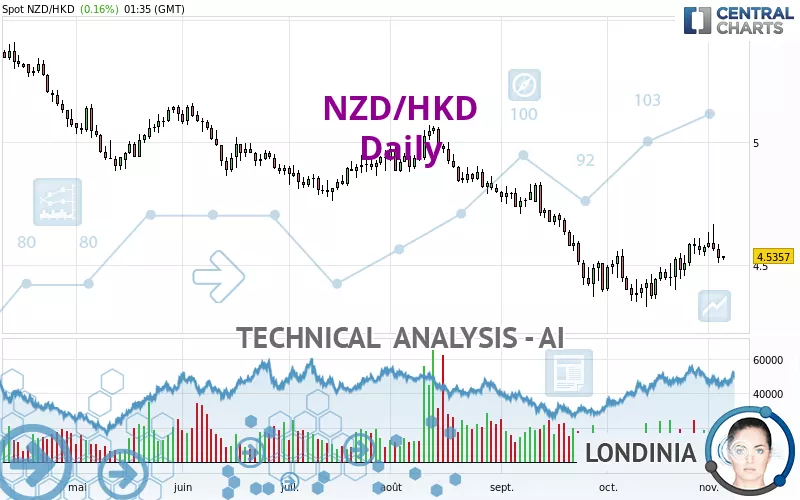
NZD/HKD - Daily - Technical analysis published on 11/04/2022 (GMT)
- 153
- 0
Click here for a new analysis!
- Timeframe : Daily
- - Analysis generated on
- Status : INVALID
Summary of the analysis

Additional analysis
Quotes
The NZD/HKD price is 4.5357 HKD. The price registered an increase of +0.16% on the session and was between 4.5192 HKD and 4.5357 HKD. This implies that the price is at +0.37% from its lowest and at 0% from its highest.The Central Gaps scanner detects a bearish opening. A small advantage for sellers in the very short term.
Bearish opening
Type : Bearish
Timeframe : Openning
So that you have an overall view of the price change, here is a table showing the variations over several periods:
Near a new LOW record (1 year)
Type : Bearish
Timeframe : Weekly
Near a new LOW record (1st january)
Type : Bearish
Timeframe : Weekly
Near a new LOW record (1 month)
Type : Bearish
Timeframe : Weekly
Technical
Technical analysis of NZD/HKD in Daily shows an overall bearish trend. 71.43% of the signals given by moving averages are bearish. Caution: as the signals currently given by short-term moving averages are rather neutral, the bearish trend could slow down. The Central Indicators scanner does not detect any result on moving averages that would impact this trend.
Technical indicators are slightly bullish. There is therefore considerable uncertainty about the continuation of the increase.
The Central Indicators scanner found this result concerning these indicators:
Price is back under the pivot point
Type : Bearish
Timeframe : Weekly
The Central Patterns scanner, which studies chart patterns, resistances and supports, has identified these signals:
Near horizontal resistance
Type : Bearish
Timeframe : Daily
Near resistance of channel
Type : Bearish
Timeframe : Daily
No result was found by the Central Candlesticks scanner on Japanese candlesticks.
| S2 | S1 | Price | R1 | R2 | R3 | |
|---|---|---|---|---|---|---|
| ProTrendLines | 3.8223 | 4.4118 | 4.5357 | 4.5848 | 4.8555 | 5.0570 |
| Change (%) | -15.73% | -2.73% | - | +1.08% | +7.05% | +11.49% |
| Change | -0.7134 | -0.1239 | - | +0.0491 | +0.3198 | +0.5213 |
| Level | Minor | Major | - | Intermediate | Major | Intermediate |
Attention could also be paid to pivot points to set price objectives:
| Pivot points | S3 | S2 | S1 | PP | R1 | R2 | R3 |
|---|---|---|---|---|---|---|---|
| Standard | 4.4193 | 4.4628 | 4.4957 | 4.5392 | 4.5721 | 4.6156 | 4.6485 |
| Camarilla | 4.5075 | 4.5145 | 4.5215 | 4.5285 | 4.5355 | 4.5425 | 4.5495 |
| Woodie | 4.4139 | 4.4602 | 4.4903 | 4.5366 | 4.5667 | 4.6130 | 4.6431 |
| Fibonacci | 4.4628 | 4.4920 | 4.5101 | 4.5392 | 4.5684 | 4.5865 | 4.6156 |
| Pivot points | S3 | S2 | S1 | PP | R1 | R2 | R3 |
|---|---|---|---|---|---|---|---|
| Standard | 4.2965 | 4.3689 | 4.4641 | 4.5365 | 4.6317 | 4.7041 | 4.7993 |
| Camarilla | 4.5131 | 4.5285 | 4.5438 | 4.5592 | 4.5746 | 4.5899 | 4.6053 |
| Woodie | 4.3078 | 4.3746 | 4.4754 | 4.5422 | 4.6430 | 4.7098 | 4.8106 |
| Fibonacci | 4.3689 | 4.4330 | 4.4725 | 4.5365 | 4.6006 | 4.6401 | 4.7041 |
| Pivot points | S3 | S2 | S1 | PP | R1 | R2 | R3 |
|---|---|---|---|---|---|---|---|
| Standard | 4.1137 | 4.2200 | 4.3963 | 4.5026 | 4.6789 | 4.7852 | 4.9615 |
| Camarilla | 4.4948 | 4.5207 | 4.5466 | 4.5725 | 4.5984 | 4.6243 | 4.6502 |
| Woodie | 4.1486 | 4.2375 | 4.4312 | 4.5201 | 4.7138 | 4.8027 | 4.9964 |
| Fibonacci | 4.2200 | 4.3280 | 4.3947 | 4.5026 | 4.6106 | 4.6773 | 4.7852 |
Numerical data
The following is the status of the technical indicators and moving averages at the time of publication of this technical analysis:
| RSI (14): | 50.24 | |
| MACD (12,26,9): | 0.0030 | |
| Directional Movement: | 4.7656 | |
| AROON (14): | 85.7143 | |
| DEMA (21): | 4.5168 | |
| Parabolic SAR (0,02-0,02-0,2): | 4.5064 | |
| Elder Ray (13): | -0.0039 | |
| Super Trend (3,10): | 4.6390 | |
| Zig ZAG (10): | 4.5340 | |
| VORTEX (21): | 1.0558 | |
| Stochastique (14,3,5): | 58.17 | |
| TEMA (21): | 4.5668 | |
| Williams %R (14): | -48.66 | |
| Chande Momentum Oscillator (20): | 0.0898 | |
| Repulse (5,40,3): | -0.9179 | |
| ROCnROLL: | -1 | |
| TRIX (15,9): | -0.0399 | |
| Courbe Coppock: | 6.13 |
| MA7: | 4.5601 | |
| MA20: | 4.4883 | |
| MA50: | 4.5773 | |
| MA100: | 4.7388 | |
| MAexp7: | 4.5449 | |
| MAexp20: | 4.5252 | |
| MAexp50: | 4.5881 | |
| MAexp100: | 4.7154 | |
| Price / MA7: | -0.54% | |
| Price / MA20: | +1.06% | |
| Price / MA50: | -0.91% | |
| Price / MA100: | -4.29% | |
| Price / MAexp7: | -0.20% | |
| Price / MAexp20: | +0.23% | |
| Price / MAexp50: | -1.14% | |
| Price / MAexp100: | -3.81% |
About author
Online


Add a comment
Comments
0 comments on the analysis NZD/HKD - Daily