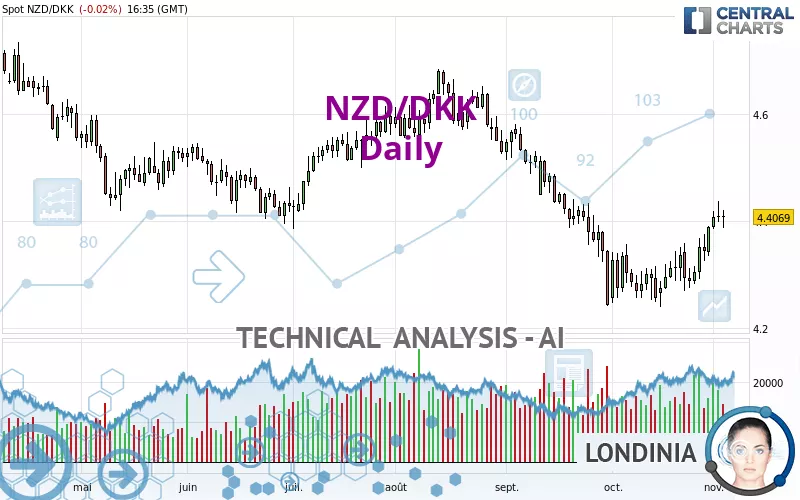
NZD/DKK - Daily - Technical analysis published on 11/03/2022 (GMT)
- 151
- 0
Click here for a new analysis!
- Timeframe : Daily
- - Analysis generated on
- Status : TARGET REACHED

Summary of the analysis

Additional analysis
Quotes
The NZD/DKK rating is 4.4069 DKK. On the day, this instrument lost -0.03% with the lowest point at 4.3866 DKK and the highest point at 4.4205 DKK. The deviation from the price is +0.46% for the low point and -0.31% for the high point.A bearish opening was detected by the Central Gaps scanner. Sellers are trying to impose a bearish trend in the very short term.
Bearish opening
Type : Bearish
Timeframe : Openning
Here is a more detailed summary of the historical variations registered by NZD/DKK:
Near a new LOW record (1 year)
Type : Bearish
Timeframe : Weekly
Near a new LOW record (1st january)
Type : Bearish
Timeframe : Weekly
Near a new LOW record (1 month)
Type : Bearish
Timeframe : Weekly
Technical
Technical analysis of NZD/DKK in Daily shows an overall slightly bearish trend. 57.14% of the signals given by moving averages are bearish. Caution: the strong bullish signals currently being given by short-term moving averages could quickly lead to a reversal of the trend. The Central Indicators scanner does not detect any result on moving averages that would impact this trend.
The probability of a further increase is high given the direction of the technical indicators.
Caution: the Central Indicators scanner currently detects an excess:
CCI indicator is overbought : over 100
Type : Neutral
Timeframe : Daily
Williams %R indicator is overbought : over -20
Type : Neutral
Timeframe : Daily
Pivot points : price is over resistance 1
Type : Neutral
Timeframe : Weekly
The Central Patterns scanner, which studies chart patterns, resistances and supports, has identified this signal:
Near resistance of channel
Type : Bearish
Timeframe : Daily
The presence of these Japanese chandelier patterns detected by Central Candlesticks that could impact the current short-term trend were also noted:
Bearish harami
Type : Bearish
Timeframe : Daily
Doji
Type : Neutral
Timeframe : Daily
| S3 | S2 | S1 | Price | R1 | R2 | R3 | |
|---|---|---|---|---|---|---|---|
| ProTrendLines | 4.1598 | 4.2426 | 4.3399 | 4.4069 | 4.4082 | 4.4938 | 4.5384 |
| Change (%) | -5.61% | -3.73% | -1.52% | - | +0.03% | +1.97% | +2.98% |
| Change | -0.2471 | -0.1643 | -0.0670 | - | +0.0013 | +0.0869 | +0.1315 |
| Level | Major | Major | Major | - | Major | Intermediate | Minor |
Attention could also be paid to pivot points to set price objectives:
| Pivot points | S3 | S2 | S1 | PP | R1 | R2 | R3 |
|---|---|---|---|---|---|---|---|
| Standard | 4.3528 | 4.3753 | 4.3917 | 4.4142 | 4.4306 | 4.4531 | 4.4695 |
| Camarilla | 4.3973 | 4.4009 | 4.4044 | 4.4080 | 4.4116 | 4.4151 | 4.4187 |
| Woodie | 4.3497 | 4.3738 | 4.3886 | 4.4127 | 4.4275 | 4.4516 | 4.4664 |
| Fibonacci | 4.3753 | 4.3902 | 4.3994 | 4.4142 | 4.4291 | 4.4383 | 4.4531 |
| Pivot points | S3 | S2 | S1 | PP | R1 | R2 | R3 |
|---|---|---|---|---|---|---|---|
| Standard | 4.1783 | 4.2236 | 4.2834 | 4.3287 | 4.3885 | 4.4338 | 4.4936 |
| Camarilla | 4.3143 | 4.3239 | 4.3336 | 4.3432 | 4.3528 | 4.3625 | 4.3721 |
| Woodie | 4.1856 | 4.2272 | 4.2907 | 4.3323 | 4.3958 | 4.4374 | 4.5009 |
| Fibonacci | 4.2236 | 4.2638 | 4.2886 | 4.3287 | 4.3689 | 4.3937 | 4.4338 |
| Pivot points | S3 | S2 | S1 | PP | R1 | R2 | R3 |
|---|---|---|---|---|---|---|---|
| Standard | 4.1368 | 4.1876 | 4.2874 | 4.3382 | 4.4380 | 4.4888 | 4.5886 |
| Camarilla | 4.3457 | 4.3595 | 4.3733 | 4.3871 | 4.4009 | 4.4147 | 4.4285 |
| Woodie | 4.1612 | 4.1999 | 4.3118 | 4.3505 | 4.4624 | 4.5011 | 4.6130 |
| Fibonacci | 4.1876 | 4.2452 | 4.2807 | 4.3382 | 4.3958 | 4.4313 | 4.4888 |
Numerical data
The following are the details of the technical indicators and moving averages that were collected to generate this technical analysis:
| RSI (14): | 59.42 | |
| MACD (12,26,9): | 0.0048 | |
| Directional Movement: | 9.0047 | |
| AROON (14): | 85.7142 | |
| DEMA (21): | 4.3433 | |
| Parabolic SAR (0,02-0,02-0,2): | 4.3434 | |
| Elder Ray (13): | 0.0478 | |
| Super Trend (3,10): | 4.4310 | |
| Zig ZAG (10): | 4.4071 | |
| VORTEX (21): | 1.1141 | |
| Stochastique (14,3,5): | 87.89 | |
| TEMA (21): | 4.3825 | |
| Williams %R (14): | -14.67 | |
| Chande Momentum Oscillator (20): | 0.1129 | |
| Repulse (5,40,3): | 0.6923 | |
| ROCnROLL: | 1 | |
| TRIX (15,9): | -0.0573 | |
| Courbe Coppock: | 4.04 |
| MA7: | 4.3725 | |
| MA20: | 4.3199 | |
| MA50: | 4.3946 | |
| MA100: | 4.4686 | |
| MAexp7: | 4.3779 | |
| MAexp20: | 4.3495 | |
| MAexp50: | 4.3882 | |
| MAexp100: | 4.4376 | |
| Price / MA7: | +0.79% | |
| Price / MA20: | +2.01% | |
| Price / MA50: | +0.28% | |
| Price / MA100: | -1.38% | |
| Price / MAexp7: | +0.66% | |
| Price / MAexp20: | +1.32% | |
| Price / MAexp50: | +0.43% | |
| Price / MAexp100: | -0.69% |
About author
Online


Add a comment
Comments
0 comments on the analysis NZD/DKK - Daily