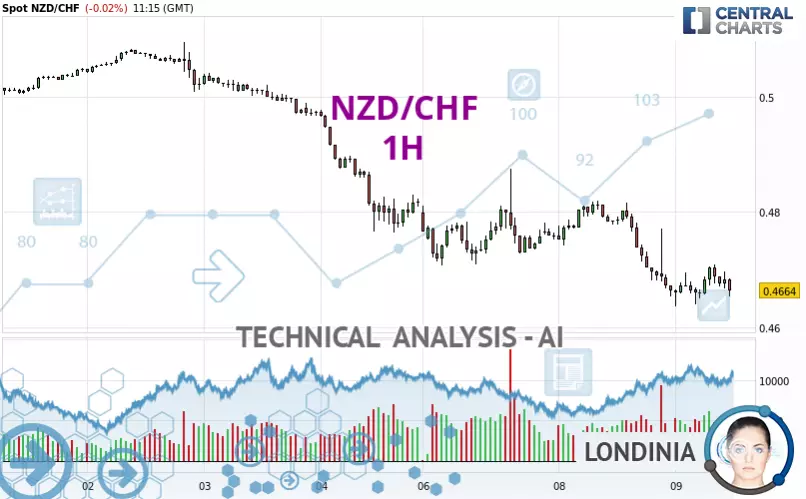
NZD/CHF - 1H - Technical analysis published on 04/09/2025 (GMT)
- 92
- 0
Click here for a new analysis!
- Timeframe : 1H
- - Analysis generated on
- Status : INVALID

Summary of the analysis

Additional analysis
Quotes
NZD/CHF rating 0.4664 CHF. The price registered a decrease of -0.02% on the session and was between 0.4637 CHF and 0.4710 CHF. This implies that the price is at +0.58% from its lowest and at -0.98% from its highest.Here is a more detailed summary of the historical variations registered by NZD/CHF:
New LOW record (5 years)
Type : Bearish
Timeframe : Weekly
New LOW record (1 year)
Type : Bearish
Timeframe : Weekly
New LOW record (1st january)
Type : Bearish
Timeframe : Weekly
New LOW record (1 month)
Type : Bearish
Timeframe : Weekly
Technical
Technical analysis of NZD/CHF in 1H shows a overall strongly bearish trend. 92.86% of the signals given by moving averages are bearish. This strongly bearish trend is supported by the strong bearish signals given by short-term moving averages. The Central Indicators market scanner is currently detecting several bullish signals that could impact this trend:
Bullish price crossover with Moving Average 20
Type : Bullish
Timeframe : 1 hour
Bullish price crossover with adaptative moving average 20
Type : Bullish
Timeframe : 1 hour
The technical indicators are generally neutral. They do not provide relevant information on the direction of future price movements.
The Central Indicators scanner specialised in technical indicators, has not detected anything further.
Central Patterns, the market scanner focusing on chart patterns, resistances and supports found this result:
Near horizontal resistance
Type : Bearish
Timeframe : 1 hour
The Central Candlesticks scanner which studies Japanese candlesticks did not detect anything.
| Price | R1 | R2 | R3 | |
|---|---|---|---|---|
| ProTrendLines | 0.4664 | 0.4708 | 0.4819 | 0.5002 |
| Change (%) | - | +0.94% | +3.32% | +7.25% |
| Change | - | +0.0044 | +0.0155 | +0.0338 |
| Level | - | Intermediate | Intermediate | Minor |
Pivot points can also be used to set your price objectives. Here is the price situation in relation to pivot points:
| Pivot points | S3 | S2 | S1 | PP | R1 | R2 | R3 |
|---|---|---|---|---|---|---|---|
| Standard | 0.4441 | 0.4548 | 0.4606 | 0.4713 | 0.4771 | 0.4878 | 0.4936 |
| Camarilla | 0.4620 | 0.4635 | 0.4650 | 0.4665 | 0.4680 | 0.4695 | 0.4710 |
| Woodie | 0.4418 | 0.4536 | 0.4583 | 0.4701 | 0.4748 | 0.4866 | 0.4913 |
| Fibonacci | 0.4548 | 0.4611 | 0.4650 | 0.4713 | 0.4776 | 0.4815 | 0.4878 |
| Pivot points | S3 | S2 | S1 | PP | R1 | R2 | R3 |
|---|---|---|---|---|---|---|---|
| Standard | 0.4362 | 0.4563 | 0.4691 | 0.4892 | 0.5020 | 0.5221 | 0.5349 |
| Camarilla | 0.4728 | 0.4758 | 0.4788 | 0.4818 | 0.4848 | 0.4878 | 0.4909 |
| Woodie | 0.4325 | 0.4545 | 0.4654 | 0.4874 | 0.4983 | 0.5203 | 0.5312 |
| Fibonacci | 0.4563 | 0.4689 | 0.4767 | 0.4892 | 0.5018 | 0.5096 | 0.5221 |
| Pivot points | S3 | S2 | S1 | PP | R1 | R2 | R3 |
|---|---|---|---|---|---|---|---|
| Standard | 0.4795 | 0.4890 | 0.4950 | 0.5045 | 0.5105 | 0.5200 | 0.5260 |
| Camarilla | 0.4968 | 0.4983 | 0.4997 | 0.5011 | 0.5025 | 0.5039 | 0.5054 |
| Woodie | 0.4779 | 0.4881 | 0.4934 | 0.5036 | 0.5089 | 0.5191 | 0.5244 |
| Fibonacci | 0.4890 | 0.4949 | 0.4986 | 0.5045 | 0.5104 | 0.5141 | 0.5200 |
Numerical data
The following is the status of the technical indicators and moving averages at the time of publication of this technical analysis:
| RSI (14): | 38.52 | |
| MACD (12,26,9): | -0.0021 | |
| Directional Movement: | 3.3698 | |
| AROON (14): | -21.4285 | |
| DEMA (21): | 0.4668 | |
| Parabolic SAR (0,02-0,02-0,2): | 0.4649 | |
| Elder Ray (13): | -0.0009 | |
| Super Trend (3,10): | 0.4736 | |
| Zig ZAG (10): | 0.4690 | |
| VORTEX (21): | 0.8092 | |
| Stochastique (14,3,5): | 21.78 | |
| TEMA (21): | 0.4667 | |
| Williams %R (14): | -58.21 | |
| Chande Momentum Oscillator (20): | 0.0019 | |
| Repulse (5,40,3): | 0.4971 | |
| ROCnROLL: | -1 | |
| TRIX (15,9): | -0.0757 | |
| Courbe Coppock: | 1.00 |
| MA7: | 0.4852 | |
| MA20: | 0.4992 | |
| MA50: | 0.5063 | |
| MA100: | 0.5099 | |
| MAexp7: | 0.4676 | |
| MAexp20: | 0.4696 | |
| MAexp50: | 0.4737 | |
| MAexp100: | 0.4799 | |
| Price / MA7: | -3.87% | |
| Price / MA20: | -6.57% | |
| Price / MA50: | -7.88% | |
| Price / MA100: | -8.53% | |
| Price / MAexp7: | -0.26% | |
| Price / MAexp20: | -0.68% | |
| Price / MAexp50: | -1.54% | |
| Price / MAexp100: | -2.81% |
News
Don't forget to follow the news on NZD/CHF. At the time of publication of this analysis, the latest news was as follows:
-
 NZD/CHF Forecast November 18, 2024
-
NZD/CHF Forecast October 29, 2024
-
NZD/CHF Forecast September 12, 2024
-
NZD/CHF Forecast August 19, 2024
-
NZD/CHF Forecast August 14, 2024
About author
Online


Add a comment
Comments
0 comments on the analysis NZD/CHF - 1H